


 Ethereum Retreats in Bitcoin’s Shadow: ETH/USD Tests Critical Support at USD 2,075
  FxWirePro- Major Crypto levels and bias summary
  BTCUSD Coils in Tight Range: Will Geopolitical Stability Trigger a Breakout Toward $80,000?
  FxWirePro- Major Crypto levels and bias summary
  Ethereum Steady Above USD 2,000: ETH Tracks Bitcoin’s Lead as Bulls Eye a USD 2,770 Breakout
  Ethereum Trails Bitcoin’s Retreat: Key Support Levels in Focus
  Bitcoin Retreats Toward Critical Support as Geopolitical Winds Shift


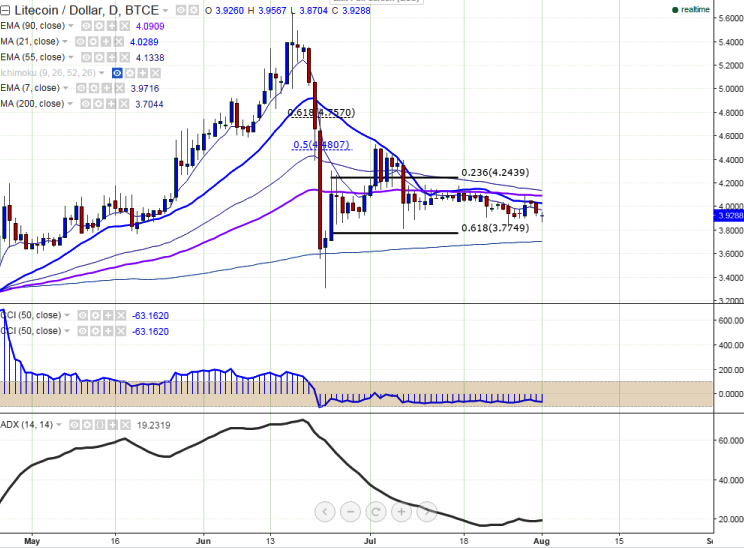
LTC/USD has fallen below the 4.00 mark and hit 3.87 levels on Monday. It is currently trading at 3.92 levels at the time of writing.
Ichimoku analysis of daily chart:
Tenkan Sen: 3.96
Kijun Sen: 4.10
Trend reversal: 4.09 (90 EMA)
The pair has substantially weakened after hitting a high of 4.10 levels last week. It is trading well below 21 MA and short-term trend appears bearish. It faces immediate resistance at 4.03 levels (21 DMA) and a break above will target 4.09 (90 EMA)/4.53 (July 2 high). On the flipside, support is seen at 3.81 levels (July 7 low) and a break below will see the pair falling to 3.70 levels (200 DMA)/3.31 (June 23 low).

- News

- Economy

- Central Banks
- Investing
- Research
- Roundups
- Digital Currency
- Insights
- Technical Analysis
- Technology
- Business
- Law
- Health
- Nature
- Fintech
- Science
- Topic
- Opinions
- ©Econometrics LLC . All Rights Reserved.
LTC/USD further weakens, dip till 3.70 likely
Monday, August 1, 2016 11:36 AM UTC
Editor's Picks


- Market Data
Most Popular


