


 FxWirePro- Major Crypto levels and bias summary


Last year, the journey from $735.3 to a whopping $19,891. (at BITFINEX exchange), or 2,605% surge was commendable. However, on the contrary, the Bitcoin bears have held steady from the last couple of months’ trading sessions.
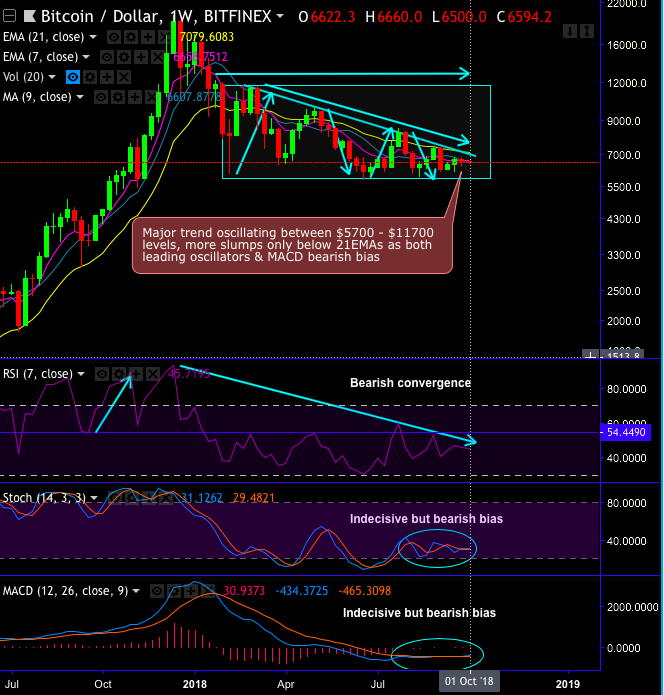
On an intermediate trend perspective, the pair has tested the strong support several times in the recent past at 78.6% fibonacci levels from the peaks of last december’2017 (i.e. 5701 levels) but for now, failure swings are observed at 21EMAs, the major trend wedged between 5700 - 11700 levels.
From last couple of days, the low volumes were observed in Bitcoin trades that has been a cause of concern for the cryptocurrency avenue. Although BTC was expected to break out of major resistance levels at $6,800 and $7,000, low volumes prevented it from recording a major movement on the upside (refer above technical chart for price oscillation between the range).
Well, for now, to evaluate the future prices for this unconventional currency BTCUSD. Pricing BTC vanilla options are available at ORE which are not straight forwards as the underlying instrument (BTCUSD) is a new and a heavily volatile asset class. But, ORE seems to be exploiting with advanced mathematical models and techniques in order to attempt and infer future price behavior of BTC.
While capitalizing on such Bitcoin vanilla options, BTC option traders can get a clarity about bitcoin future prices and volatility to certain extent.
Contemplating above baffling trend scenario but slightly bearish biased, 1% in-the-money put options of 1m tenor are advocated as shown in the diagram.
Why ITM instead of ATM option: Well, an ATM option which is at its optimum "disintegration" time at 30 days, it will blow up on the buyer if it moves against him/her at that point. That’s why a deep in the money call with a very strong delta will move in tandem with the underlying BTC price movements.
Currency Strength Index: FxWirePro's hourly BTC spot index is inching towards -73 levels (which is bearish), while hourly USD spot index was at 132(bullish) while articulating (at 07:13 GMT). For more details on the index, please refer below weblink:
http://www.fxwirepro.com/currencyindex
These indices are also conducive for the above trading strategy.


