


 Best Gold Stocks to Buy Now: AABB, GOLD, GDX
  US Stock Futures Fall as Treasury Yields Surge Ahead of Trump-Xi Summit
  US, China Extend Trade Truce to Jan. 10 Ahead of Trump-Xi Summit
  US Stock Futures Rise as Meta Muse Fuels AI Rally
  Russian Envoy Dmitriev Heads to US for Ukraine Talks
  FxWirePro: Daily Commodity Tracker - 21st March, 2022
  US Dollar Hits Two-Month High as Fed Rate Hike Bets Rise
  U.S. 10-Year Treasury Yield Hits 2007 High as Fed Rate Hike Bets Rise


 Add as a preferred source on Google
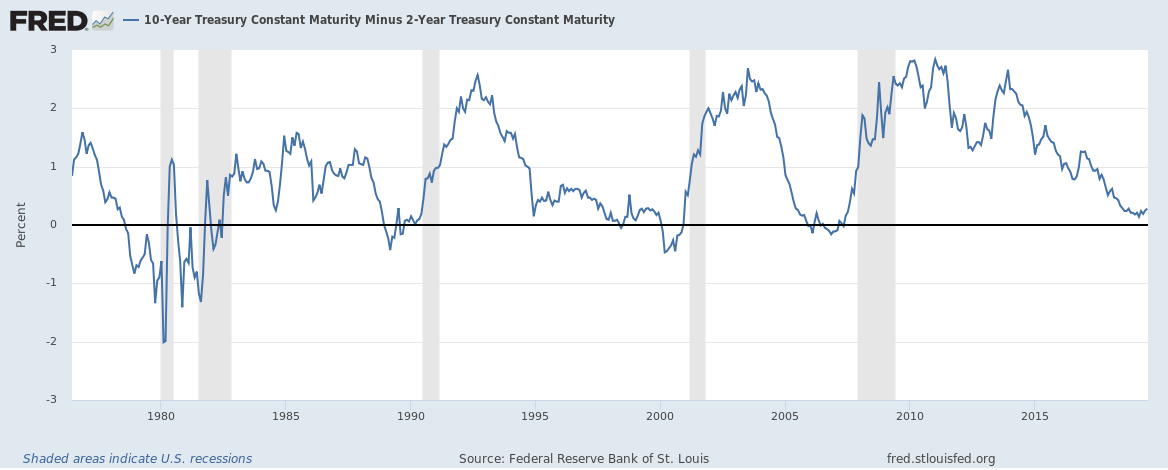
There are many indicators like PMI reports, jobs reports, inflation, industrial output, business sales, etc. that we take a look into in determining whether the US economy is slowing down and heading for a recession but there is one indicator, which we are not losing sight of, which is widely considered as the most reliable predictor of a recession and that is the yield difference between a 10-year U.S. Treasury bonds and a 2-year treasury bonds.
This chart from the St. Louis Fed’s economic dashboard shows that the spread has correctly predicted the last five recession. Every time before the US economy suffered a recession, the spread dipped below zero. Recession follows within 24 months, whenever spread dips below zero.
The spread has been steadily declining since 2014, as the U.S. Federal Reserve raised interest rates from 0.25 percent to 2.25 percent, pushing short-term rates higher, while lower inflation expectation pushed long-term yields lower.
However, there has recently been a shift upwards in this indicator, as the U.S. Federal Reserve signaled rate cuts. The upward shift further fades the possibility of an immediate recession.
Moreover, the U.S. GDP growth also suggests that the recession is still a far-fetched idea. Despite the recent slowdown, the U.S. economy grew by 3.1 percent y/y in the first quarter of 2019.







