


 Goldman Predicts 50% Odds of 10% U.S. Tariff on Copper by Q1 Close
  China's Refining Industry Faces Major Shakeup Amid Challenges
  Moody's Upgrades Argentina's Credit Rating Amid Economic Reforms
  Indonesia Surprises Markets with Interest Rate Cut Amid Currency Pressure
  Geopolitical Shocks That Could Reshape Financial Markets in 2025
  S&P 500 Relies on Tech for Growth in Q4 2024, Says Barclays
  China’s Growth Faces Structural Challenges Amid Doubts Over Data
  Global Markets React to Strong U.S. Jobs Data and Rising Yields
  Stock Futures Dip as Investors Await Key Payrolls Data
  Fed May Resume Rate Hikes: BofA Analysts Outline Key Scenarios


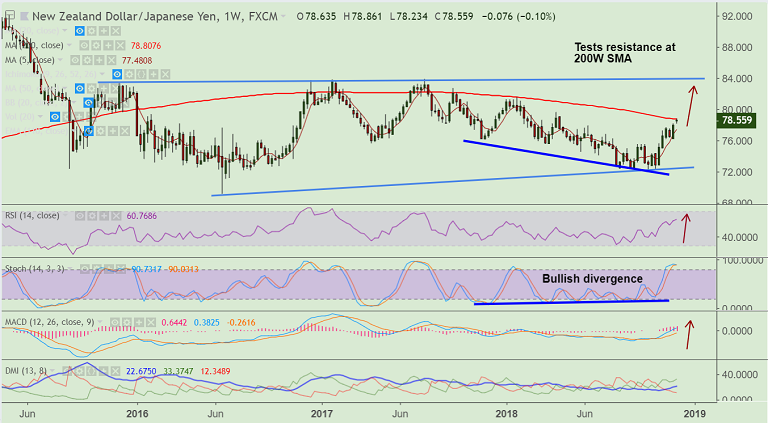
NZD/JPY chart on Trading View used for analysis
- NZD/JPY consolidates bullish gap open on Monday's trade, bias higher.
- The pair has tested major resistance at 200W SMA at 78.80, break above will propel the pair higher.
- Technical studies are supporting scope for gains. We see bullish divergence on Stochs.
- MACD and DMI support upside and Bollinger Bands are widening suggesting rising volatility.
- Break above 200W SMA raises scope for test of 83.90 (Major trendline resistance).
- On the flipside, 5-DMA is immediate support at 77.94. Break below eyes 21-EMA at 76.90
Support levels - 78.24 (5-DMA), 77.06 (21-EMA), 75.74 (200-DMA)
Resistance levels - 78.80 (200-W SMA), 83.90 (trendline)
Recommendation: Watch out for decisive breakout at 200W SMA to go long.
For details on FxWirePro's Currency Strength Index, visit http://www.fxwirepro.com/currencyindex.


