


 Gold Prices Fall Amid Rate Jitters; Copper Steady as China Stimulus Eyed
  Best Gold Stocks to Buy Now: AABB, GOLD, GDX


Here are some key charts based on data from United States’ Energy Information Agency (EIA) that explains the level of inventories, refinery demand, and production.
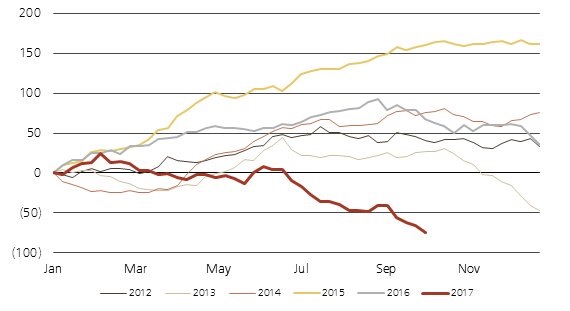
- Chart 1 shows changes in Crude total inventory including products and SPR in 2017 compared to previous years. This year, inventory has declined by 75 million barrels.
- Chart 2 shows crude oil production in the United States which declined below the Hurricane Harvey bottom and touched 8.41 million barrels per day, thanks to Hurricane Nate.
- Chart 3 has been making the refiners around the world cheer and filling OPEC with joy as it shows that distillate inventories have declined significantly and fallen to the 5-year average.
- U.S. oil imports have been declining over the past couple of year. Chart 4 shows that imports have fallen well below 5-year average thanks to the hurricane season and devastating effects of Harvey, Irma, and Nate.
- Chart 5 shows the level of U.S. crude oil exports, which recently in the last week of September reached the highest level ever around 2 million barrels per day.
- Chart 6 shows U.S. refinery demand, which suffered a major blow during Hurricane Harvey and is going down again over the effects of Hurricane Nate.
- Chart 7 shows the level of crude oil inventories, which has declined around 78 million barrels since March to 456.5 million barrels.
FxWirePro launches Absolute Return Managed Program. For more details, visit http://www.fxwirepro.com/invest


