


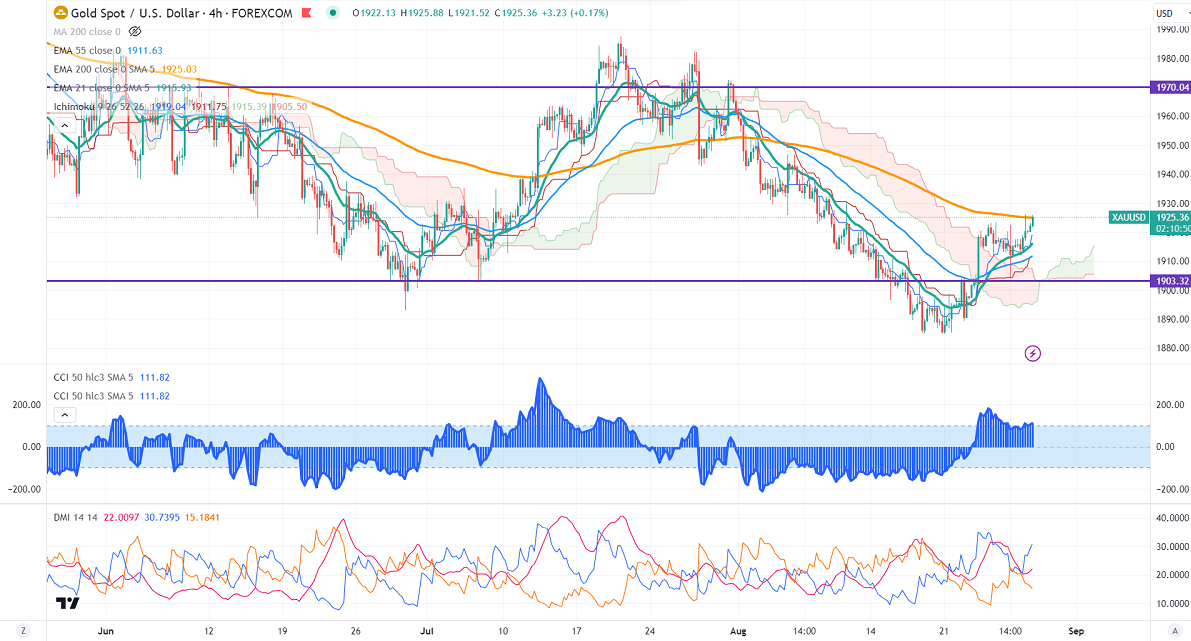
Ichimoku Analysis (4 hour chart)
Tenken-Sen- $1914.98
Kijun-Sen- $1911.28
Gold jumped sharply on easing US treasury yields. It hit a high of $1926.10 and is currently trading around $1925.49.
Major economic data for the day
Aug 29th, 2023, S&P/CS Composite-20 HPI y/y (1:00 pm GMT)
CB Consumer Confidence (2:00 pm GMT)
US dollar index- Bullish. Minor support around 103/102. The near-term resistance is 105/106.
According to the CME Fed watch tool, the probability of a no-rate hike in Sep decreased to 78% from 86% a week ago.
The US 10-year yield trades weak for the second consecutive day as markets expect a rate pause. The US 10 and 2-year spread widened to -80% from -66%.
Factors to watch for gold price action-
Global stock market- bullish (negative for gold)
US dollar index - Bullish (bearish for gold)
US10-year bond yield- Bullish (negative for gold)
Technical:
The near–term support is around $1885, a break below targets of $1847/$1820. The yellow metal faces minor resistance around $1920 and a breach above will take it to the next level of $942/$1950/$1970.
It is good to buy on dips around $1912-13 with SL around $1900 for TP of $1950/$1970.


