


 Lithium Market Poised for Recovery Amid Supply Cuts and Rising Demand
  Mexico's Undervalued Equity Market Offers Long-Term Investment Potential
  UBS Predicts Potential Fed Rate Cut Amid Strong US Economic Data
  Gold Prices Slide as Rate Cut Prospects Diminish; Copper Gains on China Stimulus Hopes
  Global Markets React to Strong U.S. Jobs Data and Rising Yields
  Moody's Upgrades Argentina's Credit Rating Amid Economic Reforms
  U.S. Treasury Yields Expected to Decline Amid Cooling Economic Pressures
  China’s Growth Faces Structural Challenges Amid Doubts Over Data
  US Gas Market Poised for Supercycle: Bernstein Analysts


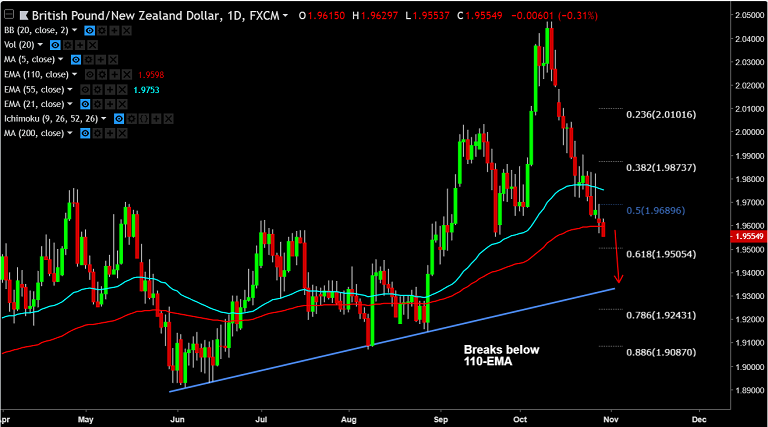
GBP/NZD chart on Trading View used for analysis
- GBP/NZD trades 0.26% lower on the day at 1.9563 at the time of writing.
- The pair is in a downtrend since 10th Oct after hitting multi-month highs of 2.047.
- Price action is has broken below support at 110-EMA, raising scope for weakness.
- Technical studies on daily charts are turning bearish. The pair has been on the decline for the 4th straight week.
- Next major support lies at 61.8% Fib at 1.9505 ahead of 1.93 (major trendline support).
- Retrace above 110-EMA eyes immediate resistance at 1.9689 (50% Fib) ahead of 1.9753 (55-EMA).
Support levels - 1.9505 (61.8% Fib), 1.93 (trendline)
Resistance levels - 1.9689 (50% Fib), 1.9753 (55-EMA)
Call update: Our previous call (https://www.econotimes.com/FxWirePro-GBP-NZD-holds-support-at-110-EMA-eyes-618-Fib-at-195-on-break-below-1449984) is progressing well.
Recommendation: Hold for targets.
For details on FxWirePro's Currency Strength Index, visit http://www.fxwirepro.com/currencyindex.


