


 FxWirePro: USD/CAD bulls continue to hold the higher ground
  Bank of America Posts Strong Q4 2024 Results, Shares Rise
  FxWirePro: USD/JPY edges higher but bulls lack punch
  Goldman Predicts 50% Odds of 10% U.S. Tariff on Copper by Q1 Close
  Stock Futures Dip as Investors Await Key Payrolls Data
  Moldova Criticizes Russia Amid Transdniestria Energy Crisis
  Gold Prices Fall Amid Rate Jitters; Copper Steady as China Stimulus Eyed
  FxWirePro: EUR/AUD downward momentum remains in place
  Energy Sector Outlook 2025: AI's Role and Market Dynamics
  FxWirePro- Woodies pivot (Major)
  U.S. Banks Report Strong Q4 Profits Amid Investment Banking Surge
  USD/CHF Smashes Higher to 0.7899 on Dollar Dominance—Bulls Bet on 0.7865 Dips for 0.8000 Breakout
  Wall Street Analysts Weigh in on Latest NFP Data
  FxWirePro: EUR/ NZD dips below lower range, bearish bias increases
  FxWirePro: GBP/AUD downside pressure builds, key support level in focus
  China’s Growth Faces Structural Challenges Amid Doubts Over Data


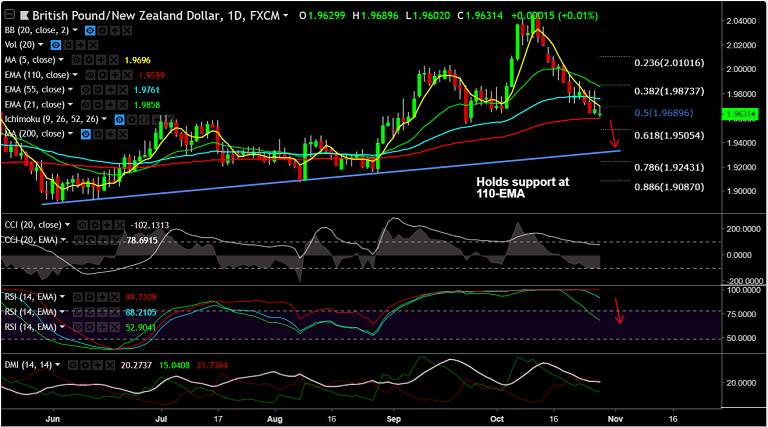
GBP/NZD chart on Trading View used for analysis
- GBP/NZD is trading largely muted at the time of writing, at 1.9631 at the time of writing.
- The pair is in a downtrend since 10th Oct after hitting multi-month highs of 2.047.
- Price action is currently holding support at 110-EMA at 1.96, break below will see resumption of weakness.
- Technical studies on daily charts are turning bearish. The pair has been on the decline for the 4th straight week.
- Next major support lies at 61.8% Fib at 1.9505 ahead of 1.93 (major trendline support).
- Rejection and bounce off 110-EMA eyes immediate resistance at 1.9761 (55-EMA) ahead of 1.9858 (21-EMA).
Support levels - 1.96 (110-EMA), 1.95 (61.8% Fib), 1.93 (trendline)
Resistance levels - 1.9695 (5-DMA), 1.9761 (55-EMA), 1.9857 (21-EMA)
Recommendation: Good to stay short on break below 110-EMA, SL: 1.9695, TP: 1.95/ 1.93
For details on FxWirePro's Currency Strength Index, visit http://www.fxwirepro.com/currencyindex.


