


 BTCUSD Coils in Tight Range: Will Geopolitical Stability Trigger a Breakout Toward $80,000?
  Ethereum’s $2,200 Ceiling: Can Diplomatic Breakthroughs Dissolve the Bearish Resistance?
  FxWirePro- Major Crypto levels and bias summary
  Bitcoin Retreats Toward Critical Support as Geopolitical Winds Shift
  Ethereum Trails Bitcoin’s Retreat: Key Support Levels in Focus
  Bitcoin Retreats as Geopolitical Tensions Flare: BTC/USD Dips Following Iran’s Rejection of Ceasefire


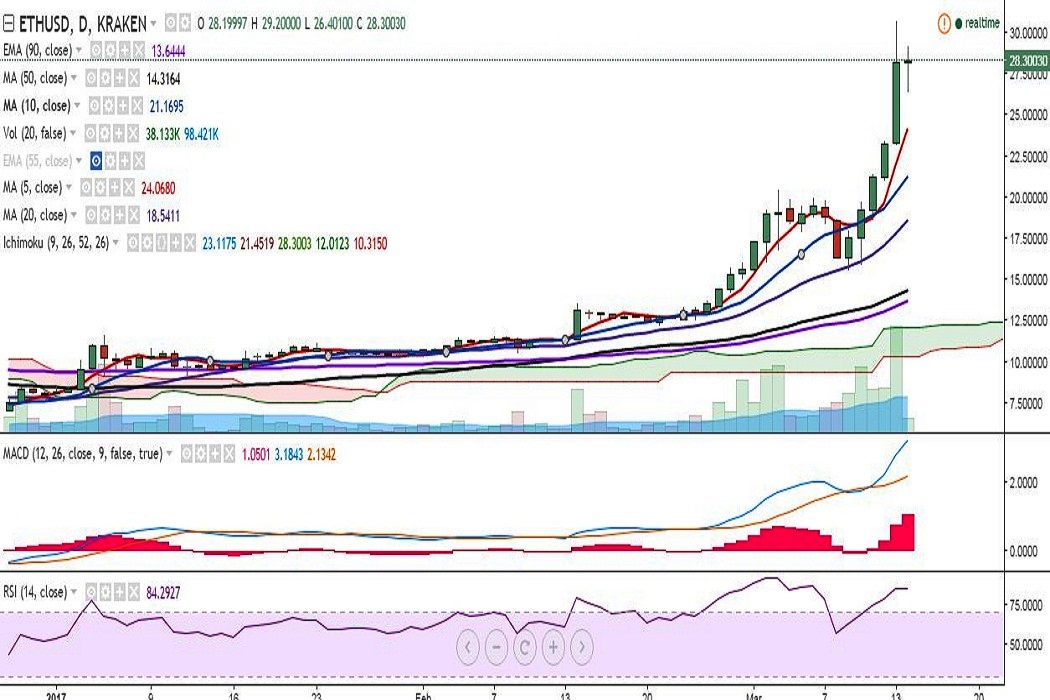
ETH/USD breached 29.49, 161.8% extension of December 06 to March 03 rally, to hit 30.67 levels on Monday, before closing at 28.19 levels. The pair has formed a doji on the daily chart and is currently trading at 28 levels at press time (Kraken).
Ichimoku analysis of daily chart:
Tenkan Sen: 23.11
Kijun Sen: 21.45
Overall trend is extremely bullish. However, caution is advised as RSI(14) and stochs are in overbought zones.
On the upside, the pair will run into resistance at 30.67 (March 13 high) and a break above would target 33.89 (113% extension of 5.92 and 30.67)/35.97 (200% retracement of 21.48 and 7).
On the hourly chart, watch out for a close below 26.79 (4H 10-SMA) for signs of minor weakness in the pair. On the daily chart, support is seen at 24.83 (23.6% retracement of 5.92 and 30.67) and a break below would drag it to 21.21/18.29.

- News

- Economy

- Central Banks
- Investing
- Research
- Roundups
- Digital Currency
- Insights
- Technical Analysis
- Technology
- Business
- Law
- Health
- Nature
- Fintech
- Science
- Topic
- Opinions
- ©Econometrics LLC . All Rights Reserved.
FxWirePro: ETH/USD largely unchanged at 28, overall bias bullish
Tuesday, March 14, 2017 11:08 AM UTC
Editor's Picks


- Market Data
Most Popular


