


 Bitcoin Retreats as Geopolitical Tensions Flare: BTC/USD Dips Following Iran’s Rejection of Ceasefire
  Ethereum’s $2,200 Ceiling: Can Diplomatic Breakthroughs Dissolve the Bearish Resistance?
  FxWirePro- Major Crypto levels and bias summary
  FxWirePro- Major Crypto levels and bias summary


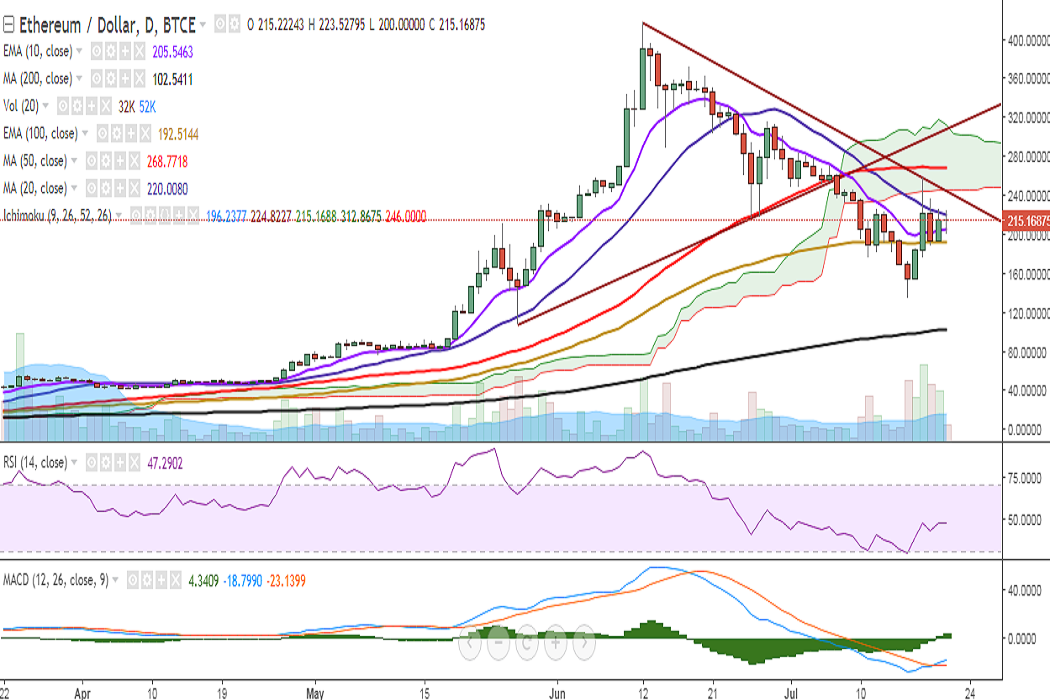
ETH/USD is struggling for a consistent break above 20-DMA and is currently trading at 214 levels at the time of writing (BTC-e).
Ichimoku analysis (Daily chart):
Tenkan-Sen: 196.23
Kijun-Sen: 224.82
On the upside, a close above 219 (20-DMA) would see the pair testing 246 (convergence of cloud bottom and trend line joining 417 and 257.85)/268 (50-DMA). Further strength would see the pair testing 307 (trend line joining 107.06 and 216.51)/356 (78.6% retracement of 417 and 134.62).
On the downside, support is seen at 192 (100-EMA) and any violation would drag it to 182 (100-DMA)/134 (July 17 low). Further weakness would see the pair testing 102 (200-DMA)/66 (113% retracement of 107.06 and 417).
Momentum studies: A bullish MACD crossover could be seen on the daily chart, while RSI is holding below 50. There are multiple rejections at 20-DMA. Moreover, the current dragonfly doji formation suggest indecisiveness in the market.
In the weekly chart, RSI is strong at 59, while stochs are biased lower. 5-DMA is biased lower and the pair is trading well below this level.
Recommendation: Wait for a clear directional bias.
FxWirePro launches Absolute Return Managed Program. For more details, visit http://www.fxwirepro.com/invest

- News

- Economy

- Central Banks
- Investing
- Research
- Roundups
- Digital Currency
- Insights
- Technical Analysis
- Technology
- Business
- Law
- Health
- Nature
- Fintech
- Science
- Topic
- Opinions
- ©Econometrics LLC . All Rights Reserved.
FxWirePro: ETH/USD forms Dragonfly Doji pattern, bias neutral
Friday, July 21, 2017 11:35 AM UTC
Editor's Picks


- Market Data
Most Popular


