


 Ethereum Retreats in Bitcoin’s Shadow: ETH/USD Tests Critical Support at USD 2,075
  FxWirePro- Major Crypto levels and bias summary
  FxWirePro: AUD/USD hovers near two-month low, outlook bearish
  FxWirePro- Major Pair levels and bias summary
  AUD/JPY Technical Outlook: Range-Bound Trading Amidst Emerging Bearish Pressure
  BTCUSD Coils in Tight Range: Will Geopolitical Stability Trigger a Breakout Toward $80,000?
  Ethereum Trails Bitcoin’s Retreat: Key Support Levels in Focus


ETHEUR on intraday terms, forms shooting star patterns at 722.50, 709.50 and 708.23 levels, while hanging man patterns at 718.85 and 722.76 levels.
On the contrary, hammer patterns have occurred at 701 -702 levels.
Shooting stars and hanging man patterns are bearish in nature that are not analyzed in isolation, these are in sync with technical indicators.
The frequent occurrence of these bearish patterns occurred at peaks of rallies have hampered the previous bullish swings, while hammer attempts to counter these price dips (refer 2H chart).
However, the current price restrained below EMAs despite the prevailing rallies,
For now, more dips seem to be on cards upon bearish EMA and MACD crossovers and mounting bearish momentum signaled by leading oscillators.
Both RSI and stochastic curves have constantly been converging downwards that indicates strength and momentum in selling sentiments.
Whereas the same is not evident even though hammer propels rallies. Hence, the bullish signal is not convincing. On intraday terms, we see more imminent bearish signal than the bullish indication.
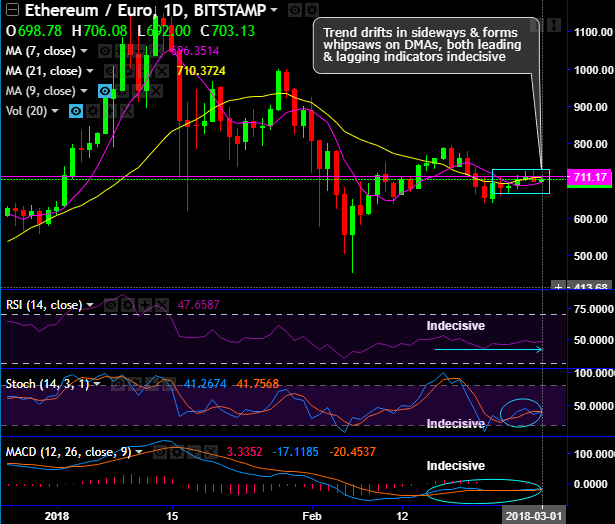
As a result, the trend on daily terms drifts in sideways and forms whipsaws on DMAs, both leading & lagging indicators indecisive.
One can think of shorting this pair on speculative grounds, long-term investors need to wait for the better clarity.
FxWirePro launches Absolute Return Managed Program. For more details, visit:


