


Refer DXY chart on Trading View
- DXY extends declines for the 4th straight session, trades 0.17% lower on the day.
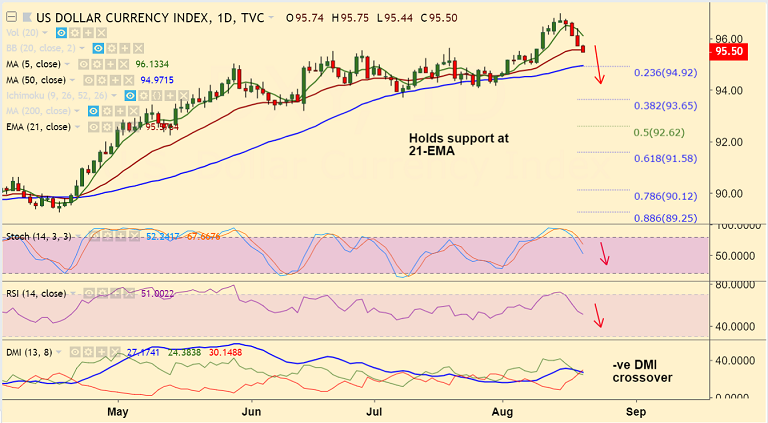
- Price is extending decline from 13-month highs at 96.86, with shooting star formation.
- Fears of the Fed slowing down the pace of policy tightening in response to criticism from the White House weighing on the dollar.
- The 10-year treasury yield fell more than five basis points to 2.82 percent yesterday, sending the USD lower across the board.
- Technical indicators are biased bearish. RSI and Stochs have rolled over from overbought levels.
- We see -ve DMI crosover on +ve DMI and MACD is on verge of a bearish crossover on signal line.
- Price has taken support at 21-EMA, decisive break below will see further weakness.
- Scope then for test of 50-DMA at 94.94 ahead of 38.2% Fib at 93.65.
Support levels - 94.97 (50-DMA), 94, 93.65 (38.2% Fib)
Resistance levels - 95.57 (21-EMA), 96.13 (5-DMA)
Call update: Our previous call (https://www.econotimes.com/FxWirePro-DXY-retraces-from-13-month-highs-at-9698-stay-short-on-break-below-9642-1H-100-SMA-1416700) has hit all targets.
Recommendation: Book partial profits. Watch out for break below 21-EMA for further weakness. Target 95/ 94.20/ 94
FxWirePro Currency Strength Index: FxWirePro's Hourly USD Spot Index was at -97.6617 (Bearish) at 0845 GMT. For more details on FxWirePro's Currency Strength Index, visit http://www.fxwirepro.com/currencyindex.


