


 Bitcoin’s Islamabad Watch: BTCUSD Consolidates Near 71,421 USD as Geopolitical Peace Talks Loom
  Ethereum’s Healthy Correction: Bulls Eye Strategic Re-Entry at 2,150 USD Following Profit-Booking Pullback
  FxWirePro: GBP/AUD takes back some lost ground
  Euro Holds the Line: EURUSD Finds Support at the 365-EMA as Peace Talks Loom
  FxWirePro: EUR/CAD gains ground on prospects of resumed energy flows
  FxWirePro: AUD/USD edged lower as early optimism over U.S.–Iran peace talks fade
  Aussie Consolidates After Peak: AUDJPY Bulls Eye a Strategic Entry for the 115.00 Target
  FxWirePro- Woodies Pivot(Major)
  FxWirePro: USD/ZAR slips sharply lower as US-Iran ceasefire lifts risk appetite
  Kiwi Ascendant: NZDJPY Bulls Eye Multi-Year Peaks Amid Triple-Day Rally
  FxWirePro- Major Pair levels and bias summary
  FxWirePro: USD/JPY steadies around 158.75, bias bullish
  FxWirePro: USD/ZAR edges lower ,investors remain on edge
  FxWirePro- Major Crypto levels and bias summary
  FxWirePro: EUR/NZD remains under pressure as key support gives way
  FxWirePro: GBP/USD bulls remain cautiously optimistic
  FxWirePro: USD/CAD extends decline on broad dollar weakness


 - EconoTimes)


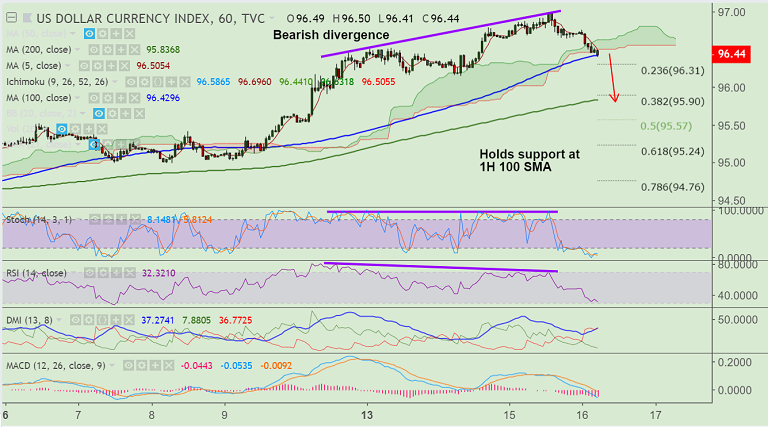
Refer DXY chart on Trading View
- The US dollar index has retraced from 13-month highs at 96.98 and is currently trading 0.29% lower on the day at 96.44.
- Intraday charts have turned bearish. Price action has dipped below cloud and we see bearish divergence which adds to downside bias.
- Shooting star formation seen on daily charts and price has dipped below 5-DMA at 96.49.
- Price is holding support at 1H 100-SMA at 96.42. Break below will see further weakness.
- Next immediate support is seen at 96.31 (23.6% Fib) ahead of 1H 200-SMA at 95.84 and then 21-EMA at 95.50.
- On the flipside, retrace and close above 5-DMA could see grind higher.
Support levels - 96.42 (1H 100-DMA), 96.31 (23.6% Fib), 95.84 (1H 200-SMA), 95.50 (21-EMA)
Resistance levels - 96.49 (5-DMA), 96.98 (Aug 15 high), 97
Recommendation: Good to go short on break below 1H 100-SMA, SL: 97, TP: 95.84/ 95.50
FxWirePro Currency Strength Index: FxWirePro's Hourly USD Spot Index was at 4.40077 (Neutral) at 0745 GMT. For more details on FxWirePro's Currency Strength Index, visit http://www.fxwirepro.com/currencyindex.


