


 FxWirePro- Major Crypto levels and bias summary
  Bitcoin Retreats Toward Critical Support as Geopolitical Winds Shift
  FxWirePro- Major Crypto levels and bias summary
  BTCUSD Coils in Tight Range: Will Geopolitical Stability Trigger a Breakout Toward $80,000?
  Ethereum Trails Bitcoin’s Retreat: Key Support Levels in Focus
  FxWirePro- Major Crypto levels and bias summary
  FxWirePro- Major Crypto levels and bias summary
  Ethereum Retreats in Bitcoin’s Shadow: ETH/USD Tests Critical Support at USD 2,075


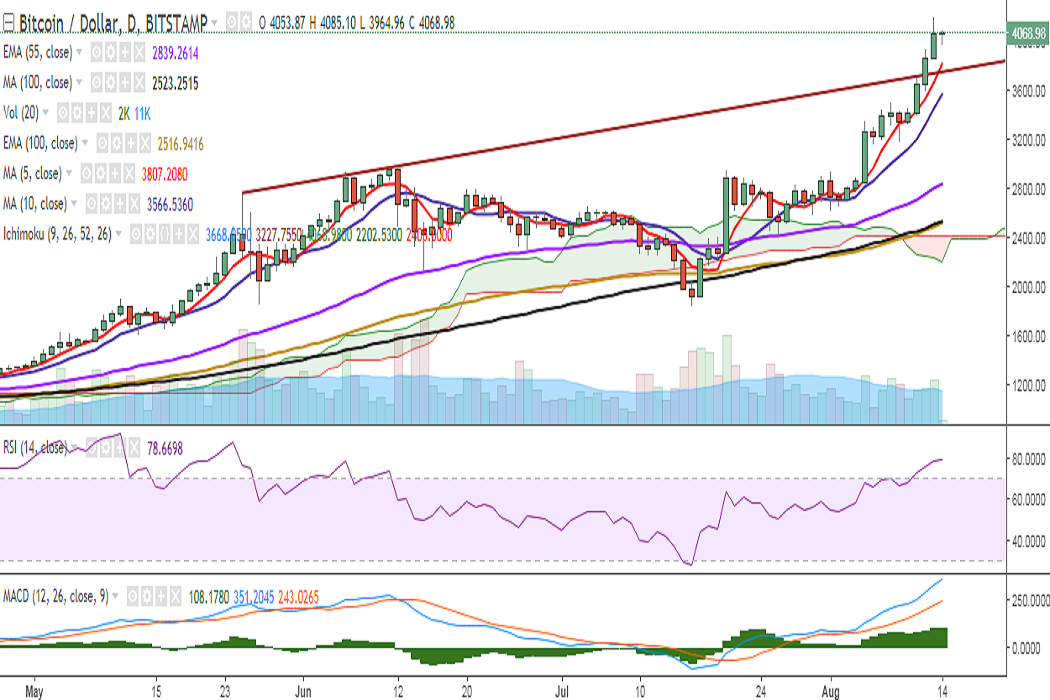
BTC/USD crossed the 4000 mark and hit a fresh all-time high at 4190 levels on August 13th. The pair is currently trading at 4060 levels at the time of writing (Bitstamp).
Ichimoku analysis of daily chart:
Tenkan Sen: 3668.05
Kijun Sen: 3227.75
On the upside, resistance is seen at 4130 (200% retracement of 2980 and 1830) and a consistent break above would target 4190 (August 13 high)/4272 (161.8% extension of 1830 and 3339.66). Further strength would see it testing 4357 (161.8% extension of 751.34 and 2980)/4496 (113% extension of 1830 and 4190).
On the downside, support is likely to be found at 3991 (2h 20-SMA) and a break below would see it testing 3948 (1h 50-SMA)/3892 (1h cloud top). Further weakness would drag it to 3807 (5-DMA)/3750 (trend line joining 2760 and 2980)/3717 (1h 100-SMA).
Momentum studies: On the daily chart, RSI holding at 78, MACD line above the signal line, and all major moving averages biased higher. However, caution is advised as stochs are in the overbought zone with bearish divergence. We could see some consolidation around current levels as dragonfly doji formation could be seen in the daily chart.
Also, in the 4-hour chart, MACD is biased lower, while RSI is at 53 and stochs are slightly biased higher. In the 2-hour chart, RSI is strong at 61, while MACD and stochs are biased lower.
Recommendation: Wait for clear directional bias.
FxWirePro launches Absolute Return Managed Program. For more details, visit http://www.fxwirepro.com/invest

- News

- Economy

- Central Banks
- Investing
- Research
- Roundups
- Digital Currency
- Insights
- Technical Analysis
- Technology
- Business
- Law
- Health
- Nature
- Fintech
- Science
- Topic
- Opinions
- ©Econometrics LLC . All Rights Reserved.
FxWirePro: BTC/USD forms ‘Dragonfly Doji’ after hitting 4190, bias neutral
Monday, August 14, 2017 7:46 AM UTC
Editor's Picks


- Market Data
Most Popular


