


 FxWirePro- Major Crypto levels and bias summary
  Ethereum Trails Bitcoin’s Retreat: Key Support Levels in Focus
  FxWirePro- Major Crypto levels and bias summary
  Ethereum Steady Above USD 2,000: ETH Tracks Bitcoin’s Lead as Bulls Eye a USD 2,770 Breakout


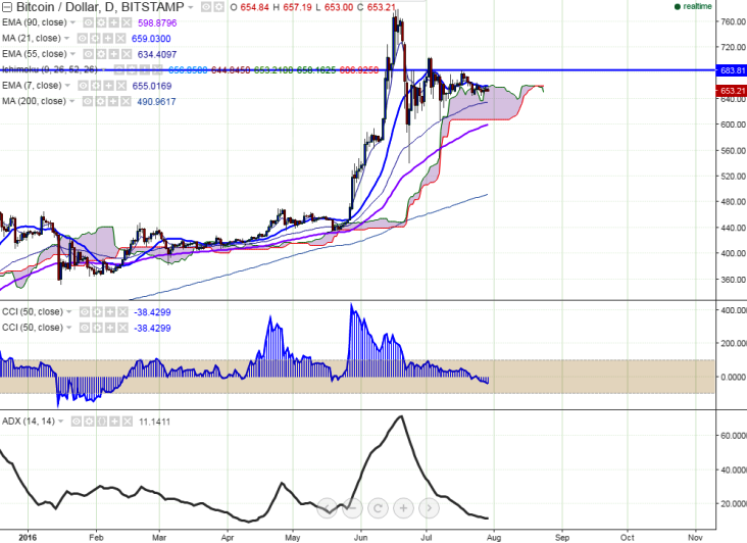
BTC/USD is seen trading in red on Friday. The pair is trading in a narrow range between $665 and $645 levels (BITSTAMP) for the past four trading session. It is currently trading at $653 at the time of writing.
Ichimoku analysis of daily chart shows:
Tenkan-Sen level: $660.40
Kijun-Sen level: $655.24
Trend reversal level - (90 EMA)-$597
Long-term trend remains to be bullish. BTC/USD faces strong support at $645 (Jul 22nd low). So further bearishness can be seen only below that level.
Major resistance is around $665 (Jul 24th high) and any break above targets $685 (Jun25th high)/ $705 (Jul 2nd high). Short term support is seen at $645 (Jul 22nd low) and any violation below will drag the pair till $630 (55 days EMA)/$605 (Jul 7th low).


