


 Ethereum’s $2,200 Ceiling: Can Diplomatic Breakthroughs Dissolve the Bearish Resistance?
  FxWirePro- Major Crypto levels and bias summary
  FxWirePro- Major Crypto levels and bias summary
  Bitcoin Retreats Toward Critical Support as Geopolitical Winds Shift
  Bitcoin Retreats as Geopolitical Tensions Flare: BTC/USD Dips Following Iran’s Rejection of Ceasefire
  Ethereum Trails Bitcoin’s Retreat: Key Support Levels in Focus
  FxWirePro- Major Crypto levels and bias summary


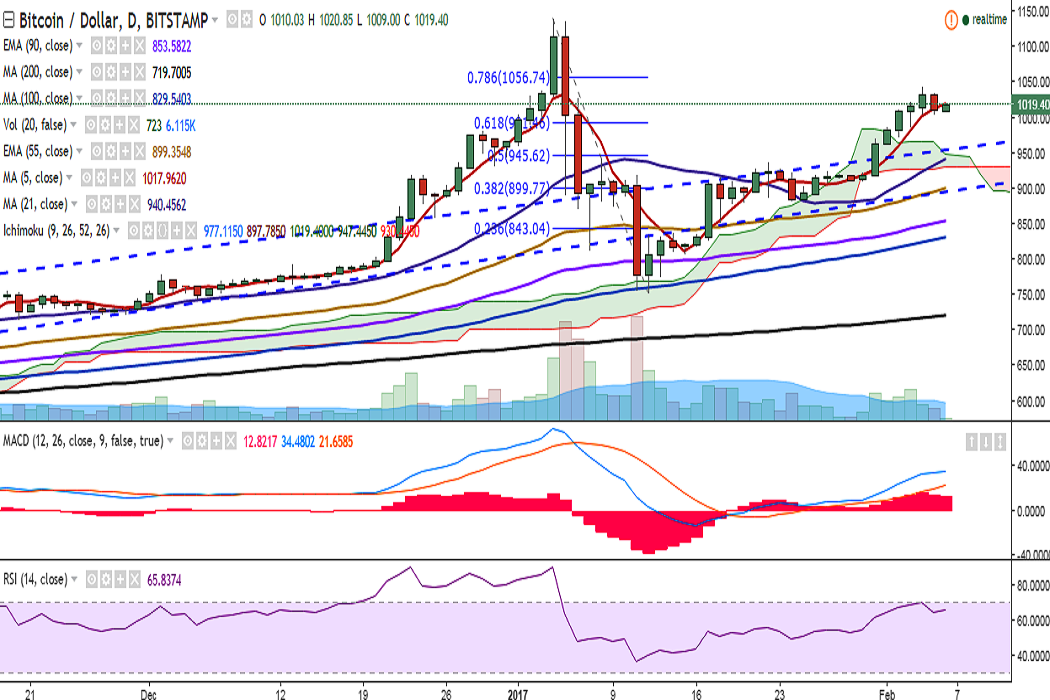
BTC/USD hit a high of 1044 levels on February 04 but failed to hold its strength. The pair is currently hovering around 5-DMA and is trading at 1013 levels at press time (Bitstamp).
Ichimoku analysis of daily chart:
Tenkan Sen: 977.11
Kijun Sen: 897.78
Trend reversal: 849.85 (90 EMA)
On the upside, a consistent break above 1044 (February 04 high) would see the pair testing 1056 (78.6% retracement of 1139.89 and 751.34)/ 1100.
Momentum studies remain bullish: RSI(14) is at 65, bias higher; and MACD line is above signal line, Stochs in overbought zone.
On the downside, the pair is likely to find support at 975 (23.6% retracement of 751.34 and 1044.23) and a break below would drag it to 955 (trend line joining 628.99 and 745.19)/931.52 (21-DMA).

- News

- Economy

- Central Banks
- Investing
- Research
- Roundups
- Digital Currency
- Insights
- Technical Analysis
- Technology
- Business
- Law
- Health
- Nature
- Fintech
- Science
- Topic
- Opinions
- ©Econometrics LLC . All Rights Reserved.
FxWirePro: BTC/USD faces resistance at 1045, break above targets 1100
Monday, February 6, 2017 6:47 AM UTC
Editor's Picks


- Market Data
Most Popular


