


 Ethereum Retreats in Bitcoin’s Shadow: ETH/USD Tests Critical Support at USD 2,075
  Ethereum’s $2,200 Ceiling: Can Diplomatic Breakthroughs Dissolve the Bearish Resistance?
  FxWirePro- Major Crypto levels and bias summary
  FxWirePro- Major Crypto levels and bias summary
  Ethereum Trails Bitcoin’s Retreat: Key Support Levels in Focus


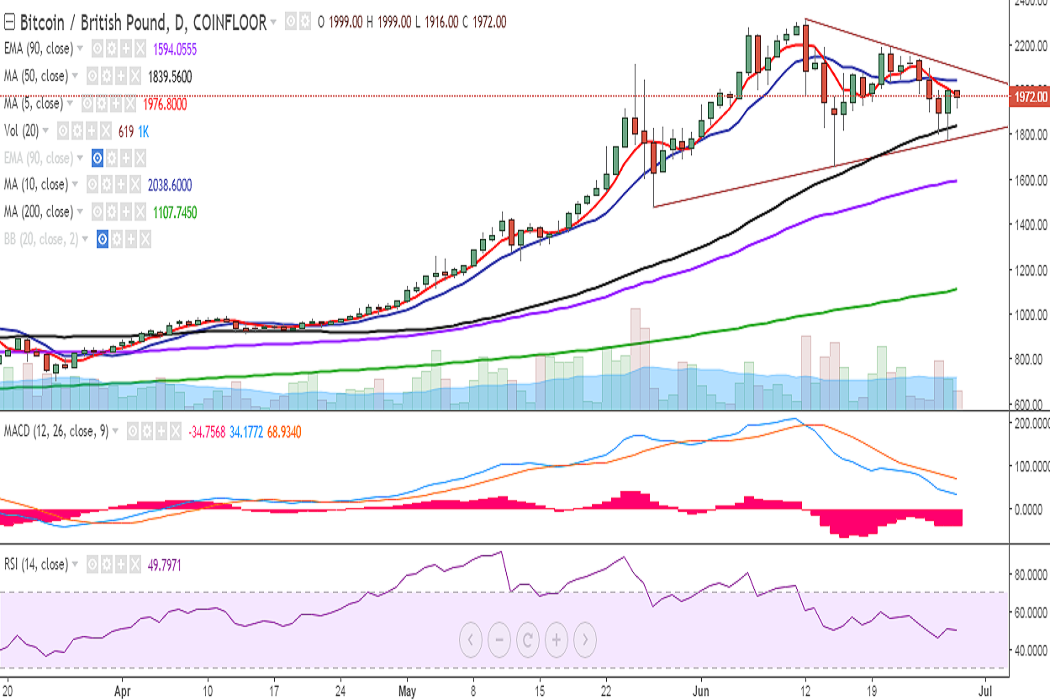
BTC/GBP closed in the green on Tuesday after it dropped to 1777 levels. It is currently trading at 1971 levels at the time of writing (Coinfloor).
Ichimoku analysis of daily chart:
Tenkan Sen: 1985
Kijun Sen: 1986
On the upside, a close above 1976 (5-DMA) would target 2038 (10-DMA)/2058 (20-DMA). Further uptrend would see the pair testing 2098 (trend line joining 2315 and 2193)/2174 (78.6% retracement of 2315 and 1657).
On the flipside, immediate support is seen at 1935 (1h 20-SMA) and any violation would drag it to 1895 (50% retracement of 1475 and 2315)/1839 (50-DMA). Further weakness would see it testing 1783 (trend line joining 1475 and 1657).
Momentum studies: On the daily chart, RSI is weak at 49, MACD line is below the signal line.
On the 2-hour chart, RSI is at 55 and stochs have rolled over into the overbought zone. The pair’s upside is being capped around 2000 levels (convergence of cloud bottom and 100-EMA) and only a consistent break above would see further upside. If this resistance holds we could see further bearishness in the pair.
Call Update: We had advised staying short in our previous call. The pair hit and surpassed TP1 on Tuesday.
Recommendation: Good to go short on break below 1935. SL: 2000. TP: 1839/1783.
FxWirePro launches Absolute Return Managed Program. For more details, visit http://www.fxwirepro.com/invest

- News

- Economy

- Central Banks
- Investing
- Research
- Roundups
- Digital Currency
- Insights
- Technical Analysis
- Technology
- Business
- Law
- Health
- Nature
- Fintech
- Science
- Topic
- Opinions
- ©Econometrics LLC . All Rights Reserved.
FxWirePro: BTC/GBP upside capped by 2H 100-EMA, good to go short on break below 1935
Wednesday, June 28, 2017 11:55 AM UTC
Editor's Picks


- Market Data
Most Popular


