


 Crypto Alpha Command: BTC & ETH derivatives Intelligence
  FxWirePro-24-Hour Crypto Category-Based Performance Dashboard


 Add as a preferred source on Google
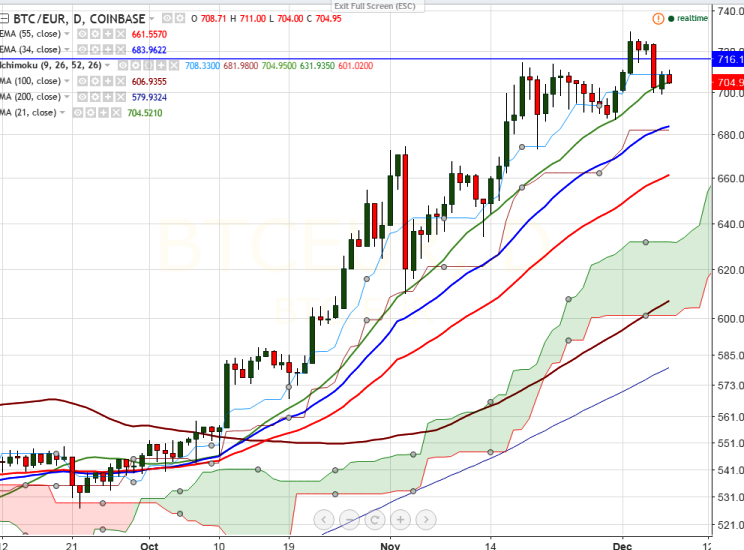
BTC/EUR is seen trading below on Wednesday. The pair declined slightly below psychological level 700 and jumped very lightly from that level (COINBASE). It is currently trading around 704.74 at the time of writing.
Ichimoku analysis of daily chart shows:
Tenkan-Sen level: 708
Kijun-Sen level: 681.98
Trend reversal level - (100 day MA) – 605
Long-term trend remains to be bullish. In the daily chart, BTC/EUR formed a temporary top around 729 and it should break above that level.
Major resistance is around 729 (Dec 2nd high) and any violation above will take the pair till 740 (161.8% retracement of 714.95 and 673)/789 (127.2% retracement of 715 and 673). Short-term support is seen at 703 (21- day MA) and any break below targets 681 (daily Kijun-Sen)/ 673 (Nov 20th, 2016 low)/634 (Nov 13th low).

- News

- Economy

- Central Banks
- Investing
- Research
- Roundups
- Digital Currency
- Insights
- Technical Analysis
- Technology
- Business
- Law
- Health
- Nature
- Fintech
- Science
- Topic
- Opinions
- ©Econometrics LLC . All Rights Reserved.
FxWirePro: BTC/EUR faces strong resistance at 729 level, good to sell on rallies
Wednesday, December 7, 2016 7:37 AM UTC
Editor's Picks



- Market Data
Most Popular




