


 FxWirePro- Major Crypto levels and bias summary
  Ethereum Steady Above USD 2,000: ETH Tracks Bitcoin’s Lead as Bulls Eye a USD 2,770 Breakout
  Ethereum Trails Bitcoin’s Retreat: Key Support Levels in Focus
  BTCUSD Coils in Tight Range: Will Geopolitical Stability Trigger a Breakout Toward $80,000?
  Ethereum’s $2,200 Ceiling: Can Diplomatic Breakthroughs Dissolve the Bearish Resistance?
  Ethereum Retreats in Bitcoin’s Shadow: ETH/USD Tests Critical Support at USD 2,075
  FxWirePro- Major Crypto levels and bias summary


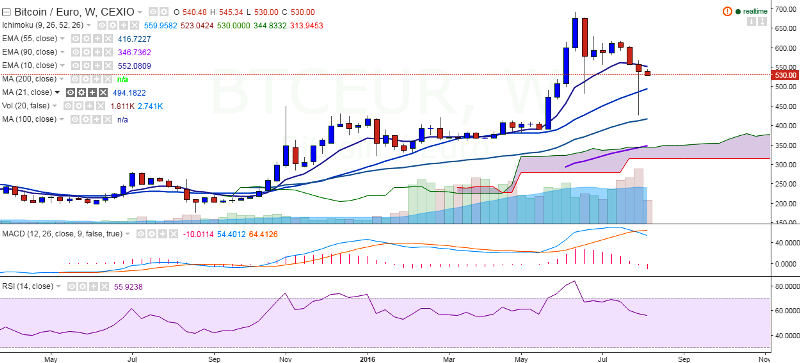
BTC/EUR is seen trading in red on Friday. The pair is trading in a narrow range between 542.50 and 530 levels (CEXIO) in the current week. It is currently trading around 530 at the time of writing.
Ichimoku analysis of weekly chart shows:
Tenkan-Sen level: 559.95
Kijun-Sen level: 512.03
Trend reversal level - (200 day MA) - 342
Long-term trend remains to be bullish. BTC/EUR is facing strong resistance around 568 (7 W EMA) and further bullishness can be seen only above that level. Any weekly close above 568 will take the pair to next level till 591/618.
Major resistance is around 568 (7 W EMA) and any break above will take the pair to next immediate resistance at 591 (61.8% retracement of 692 and 427)/618 (Jul 18th, 2016 high)/630 (Jun 27th high). Short-term support is seen at 512 (Weekly Kijun-Sen) and any break below targets 486 (21 days MA)/471 (61.8% retracement of 427 and 542.50). Major weakness can be seen below 412 (55 W EMA).

- News

- Economy

- Central Banks
- Investing
- Research
- Roundups
- Digital Currency
- Insights
- Technical Analysis
- Technology
- Business
- Law
- Health
- Nature
- Fintech
- Science
- Topic
- Opinions
- ©Econometrics LLC . All Rights Reserved.
FxWirePro: BTC/EUR faces strong resistance at 7-W EMA, good to buy at dips
Friday, August 12, 2016 4:55 AM UTC
Editor's Picks


- Market Data
Most Popular


