


 BTCUSD Coils in Tight Range: Will Geopolitical Stability Trigger a Breakout Toward $80,000?
  FxWirePro- Major Crypto levels and bias summary
  FxWirePro- Major Crypto levels and bias summary
  Ethereum Trails Bitcoin’s Retreat: Key Support Levels in Focus
  Bitcoin Retreats Toward Critical Support as Geopolitical Winds Shift
  Bitcoin Retreats as Geopolitical Tensions Flare: BTC/USD Dips Following Iran’s Rejection of Ceasefire


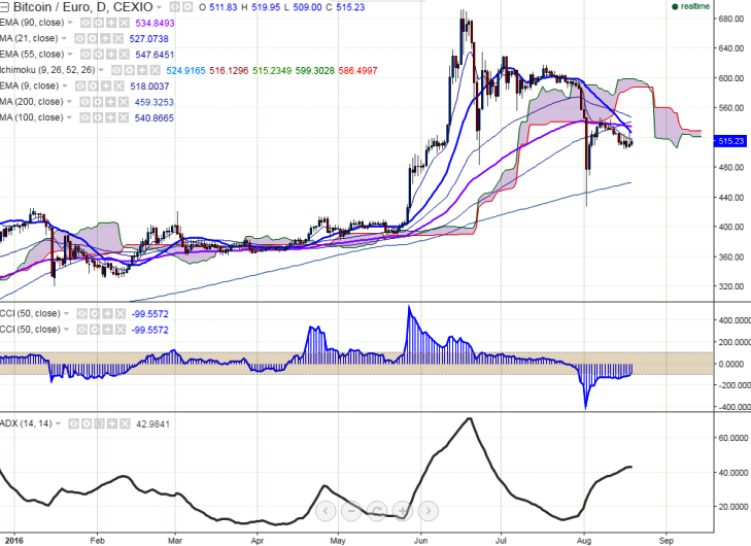
BTC/EUR is seen trading slightly above on Friday after the plunge. The pair has slightly jumped till 528 yesterday and declined from that level (CEXIO). It is currently trading around 515.06 at the time of writing.
Ichimoku analysis of daily chart shows:
Tenkan-Sen level: 524.91
Kijun-Sen level: 516.37
Trend reversal level - (90 days EMA)-535.29
Long-term trend remains to be bullish. In the daily chart, BTC/EUR is facing strong resistance at 21-day MA (528) and any violation below confirms minor bullishness.
Major resistance is around 528 (21 – day MA) and any violation above will take the pair till 535.29 (90 days EMA)/ 548 (55 days EMA). The pair should close above 550 for further bullishness. Short-term support is seen at 500 and any break below targets 480 (Jun 23rd low)/458 (200 day MA).

- News

- Economy

- Central Banks
- Investing
- Research
- Roundups
- Digital Currency
- Insights
- Technical Analysis
- Technology
- Business
- Law
- Health
- Nature
- Fintech
- Science
- Topic
- Opinions
- ©Econometrics LLC . All Rights Reserved.
FxWirePro: BTC/EUR faces strong resistance at 21-day MA, good to sell on rallies
Friday, August 19, 2016 7:41 AM UTC
Editor's Picks


- Market Data
Most Popular


