


 FxWirePro: AUD/USD downside pressure builds, key support level in focus
  FxWirePro: USD/JPY edges up, looks to extend gains
  NZDJPY in Consolidation: Navigating the 92.00 Range as Bearish Clouds Gather
  FxWirePro- Major Crypto levels and bias summary
  FxWirePro: GBP/USD downside pressure builds, key support level in focus
  FxWirePro- Major European Indices
  FxWirePro: GBP/AUD edges lower, downside risk remains
  FxWirePro: USD/CAD positions for another climb, eyes 1.3900 level


 - EconoTimes)


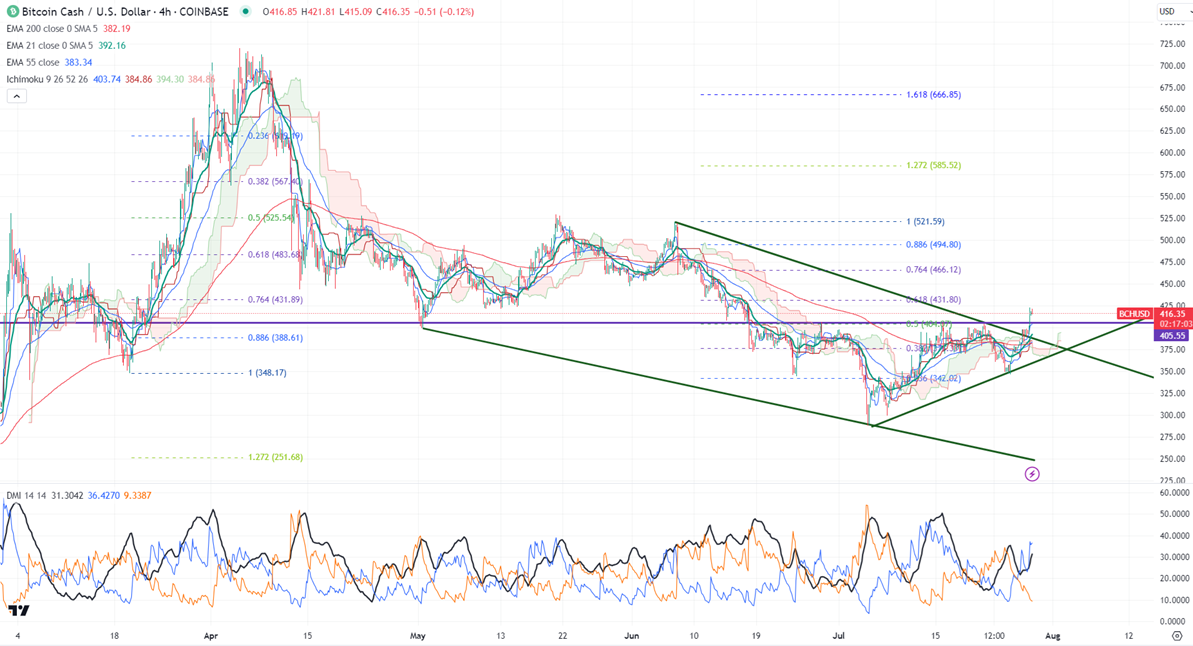
Ichimoku analysis (4- hour chart)
Tenken-Sen- $402.77
Kijun-Sen- $384.86
Horizontal trend line- $405
Downtrend channel resistance- $392
BCHUSD has performed well after a minor sell-off.
Any daily close above $390 confirms further bullishness.
The pair traded weak after forming a minor top around $525 on May 21st, 2024. Any major trend reversal can happen only if it closes above $525.
BCHUSD prices have surged more than 20% in the past three days. It hit a high of $423 at the time of writing and is currently trading around $418.59. The pair holds above the short-term (21 and 55-day EMA) and above the long-term moving average (200-day EMA).
The near-term resistance is around $432, any indicative breach above will take the pair to $466/$500/$525. On the lower side, immediate support is $380, and any violation below targets $345/$300.
Indicators ( 4- hour chart)
Directional movement index - Bullish
It is good to buy on dips for around $400 with SL of around $340 for TP of $520.


