


 China’s Growth Faces Structural Challenges Amid Doubts Over Data
  U.S. Stocks vs. Bonds: Are Diverging Valuations Signaling a Shift?
  Mexico's Undervalued Equity Market Offers Long-Term Investment Potential
  China's Refining Industry Faces Major Shakeup Amid Challenges
  Moldova Criticizes Russia Amid Transdniestria Energy Crisis
  UBS Predicts Potential Fed Rate Cut Amid Strong US Economic Data
  U.S. Banks Report Strong Q4 Profits Amid Investment Banking Surge
  US Gas Market Poised for Supercycle: Bernstein Analysts


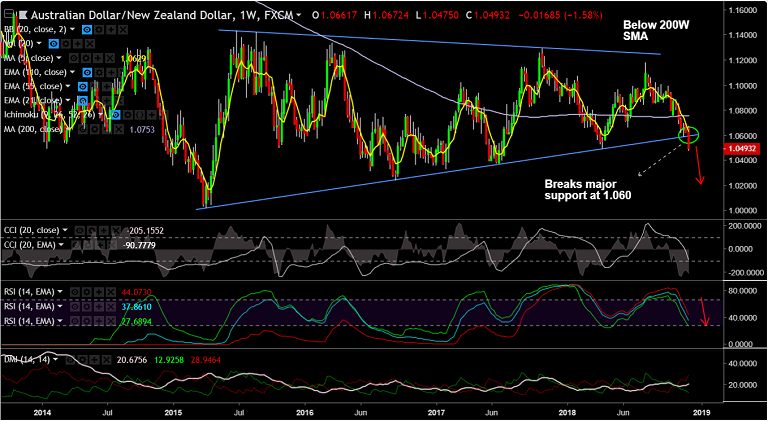
AUD/NZD chart on Trading View used for analysis
- AUD/NZD has broken "Symmetric Triangle" pattern, raising scope for further downside.
- The pair is extending weakness for the 6th straight session and hit 15-month lows at 1.0475.
- Breach at 'Triangle Base' support at 1.06 has opened up downside for the pair.
- Technicals support further weakness, drag till 1.0370 (Jun 2017 low) now likely.
- Technical indicators on weekly charts are also bearish. Stochs and RSI sharply lower.
- MACD supports downside. We see -ve DMI dominance and ADX rising in support of weakness.
- Price has slipped below weekly cloud and 200-W SMA and we see bearish invalidation only on retrace above.
Call update: Our previous call (https://www.econotimes.com/FxWirePro-AUD-NZD-Near-Term-Outlook-1467221) has hit targets.
Recommendation: Book partial profits, stay short for further downside. Target 1.0370.
For details on FxWirePro's Currency Strength Index, visit http://www.fxwirepro.com/currencyindex.


