


 China's Refining Industry Faces Major Shakeup Amid Challenges
  S&P 500 Relies on Tech for Growth in Q4 2024, Says Barclays
  Mexico's Undervalued Equity Market Offers Long-Term Investment Potential
  Gold Prices Fall Amid Rate Jitters; Copper Steady as China Stimulus Eyed
  Fed May Resume Rate Hikes: BofA Analysts Outline Key Scenarios
  UBS Projects Mixed Market Outlook for 2025 Amid Trump Policy Uncertainty
  Trump’s "Shock and Awe" Agenda: Executive Orders from Day One
  Wall Street Analysts Weigh in on Latest NFP Data


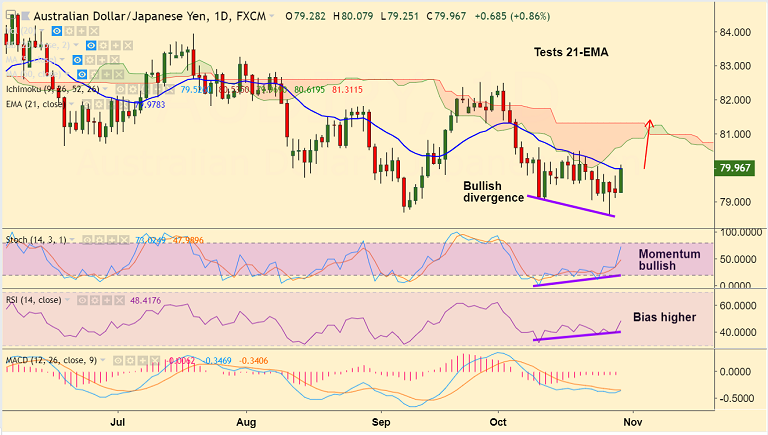
AUD/JPY chart on Trading View used for analysis
- AUD/JPY tests 21-EMA at 79.98, break above to see further upside.
- The pair has spiked 0.92% on the day and is trading at 80.00 at the time of writing.
- Technical indicators have turned bullish and we see scope for further upside.
- Stochs and RSI have turned higher and MACD is on verge of bullish crossover on signal line.
- We also evidence 'Bullish Divergence' on RSI and Stochs which adds to the bullish bias.
- Breakout at 21-EMA eyes 55-EMA at 80.57 ahead of daily cloud at 80.61. Rejection at 21-EMA could see weakness till 78.56.
- Investors look forward to BoJ on Wednesday for fresh directional impetus.
Support levels - 79.48 (5-DMA), 78.90 (lower BB), 78.56 (Oct 26 low)
Resistance levels - 80.57 (55-EMA), 81.30 (110-EMA), 82.31 (200-DMA)
For details on FxWirePro's Currency Strength Index, visit http://www.fxwirepro.com/currencyindex.


