


 US Gas Market Poised for Supercycle: Bernstein Analysts
  US Futures Rise as Investors Eye Earnings, Inflation Data, and Wildfire Impacts
  Indonesia Surprises Markets with Interest Rate Cut Amid Currency Pressure
  UBS Projects Mixed Market Outlook for 2025 Amid Trump Policy Uncertainty
  Energy Sector Outlook 2025: AI's Role and Market Dynamics
  Oil Prices Dip Slightly Amid Focus on Russian Sanctions and U.S. Inflation Data
  2025 Market Outlook: Key January Events to Watch
  U.S. Banks Report Strong Q4 Profits Amid Investment Banking Surge
  China's Refining Industry Faces Major Shakeup Amid Challenges
  Bank of America Posts Strong Q4 2024 Results, Shares Rise
  UBS Predicts Potential Fed Rate Cut Amid Strong US Economic Data


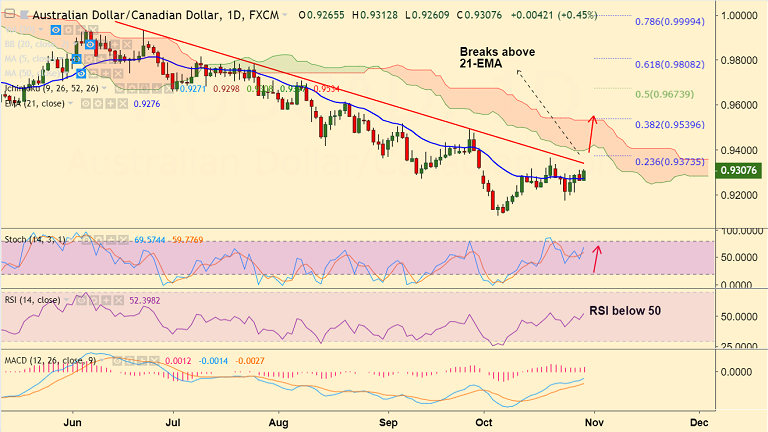
AUD/CAD chart on Trading View used for analysis
- AUD/CAD has shown a break above 21-EMA, intraday bias higher.
- The pair has hit highs of 0.9312 before paring some gains to currently trade at 0.93.
- Momentum studies are bullish, RSI is biased higher and holds above 50 mark.
- MACD supports upside in the pair and bollinger bands are widening suggesting rise in volatility.
- We see scope for test of 55-EMA at 0.9361, break above to see further gains.
- Major trend still remains bearish. Breakout at 110-EMA to see bearish invalidation.
Support levels - 0.9276 (21-EMA), 0.9238 (20-DMA), 0.9124 (Lower BB)
Resistance levels - 0.9361 (55-EMA), 0.94, 0.9484 (110-EMA)
Recommendation: Good to stay long on dips, SL: 0.9240, TP: 0.9360/ 0.94/ 0.9480
For details on FxWirePro's Currency Strength Index, visit http://www.fxwirepro.com/currencyindex.


