


Shiller PE is an important tool to measure fundamental valuation in stocks, which was explained by Robert Shiller in his book, Irrational Exuberance. It is based on price to earnings ratio that is calculated using average inflation-adjusted earnings from the past 10 years. It is also popularly known as CAPE or cyclically adjusted PE ratio.
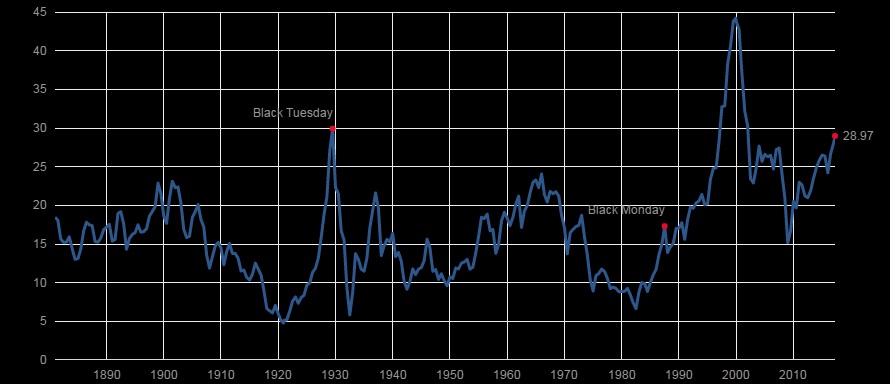
The data show that Shiller PE is currently at 28.97, which 73 percent more than its long-term average. It has now surpassed the 2008 peak and is currently heading to challenge the 30 level that was reached before the ‘Great Depression’ of 30’s set in. The highest level it ever reached is 44.19 in 1999 before the dot-com bubble burst.
The high level of Shiller PE certainly calls for caution but this indicator alone is not sufficient to foretell the end of the current bull market. S&P500 is in its ninth year of the bull run and is currently trading at 2354.


