


The US benchmark stock index, S&P 500 is currently trading at 2438 as it continues its march to new record highs regularly. Since the election of Donald Trump, the benchmark stock index has risen by almost 14 percent and almost 9 percent since the beginning of the year. While many in the financial markets have remained optimistic on the index, some analysts have been warning that S&P 500’s record breaking run of 8 long years could come to a halt.
In this article, we are going to measure S&P 500 valuations from a historical perspective using its relative value against gold and oil. Since gold acts as a storage of wealth, it is significant in valuing S&P500 and oil is considered as a fuel for global economic growth.
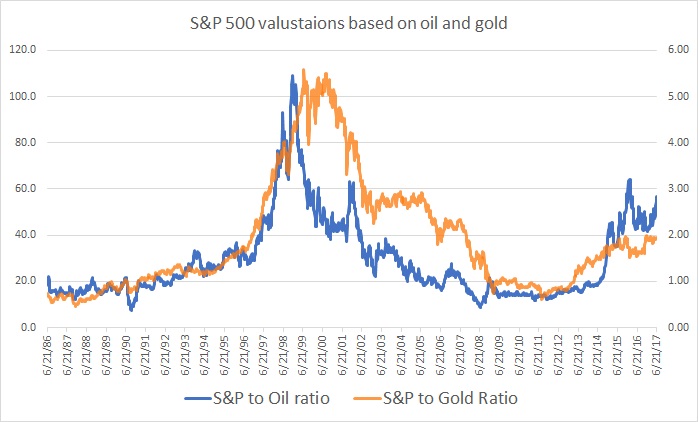
The chart shows the ratio of S&P 500 against gold and oil. We currently see that one S&P 500 index can buy 1.95 troy ounces of gold, which is not far from its historical average around 1.92 troy ounces. Similarly, S&P 500 index buys around 55.6 barrels of WTI crude oil, which is 93 percent more than its long-term average of 28.8 barrels. So, currently there is some divergence going on in terms of oil but according to gold, S&P 500 is not at all overvalued.
There is another interesting thing to note here, the value of S&P 500 against oil and gold peaked around 2000, coinciding with dot com bubble in the United States and the value of S&P 500 has been in decline against these two since. Once can also note that the change occurred during 2011 and the ratio has been moving up since. If history is any guide it certainly looks like that this new trend which began in 2011 would continue further.


