


 ETHUSD Blasts Past $2000 Milestone — Following Bitcoin’s Lead, Bulls Charge Toward $2380–$2500
  FxWirePro: USD/CNY hits 34-month low as Yuan extends rally
  FxWirePro- Major Pair levels and bias summary
  FxWirePro: EUR/NZD downside pressure builds, key support level in focus
  FxWirePro: USD/ZAR edges higher but bearish outlook persists
  FxWirePro- Woodies Pivot(Major)
  FxWirePro- Major Crypto levels and bias summary
  FxWirePro- Major Crypto levels and bias summary
  FxWirePro- Major European Indices
  FxWirePro: NZD/USD firms , scope for further upside
  FxWirePro- Woodies Pivot(Major)
  FxWirePro- Major European Indices
  GBPJPY Peaks at 212.12 Before Profit-Taking Hits — Bulls Still in Control, Buy the Dip to 214
  FxWirePro: USD/CAD eases slightly but trend is still bullish
  BTC Hovers Flat Near $68K Ahead of US-Iran Talks — Bulls Eye Break Above $70,050 for $78K Rocket
  CAD/JPY Retreats to 114.06 — 4H Chart Screams Bullish, Dip Buyers Target 115 Breakout


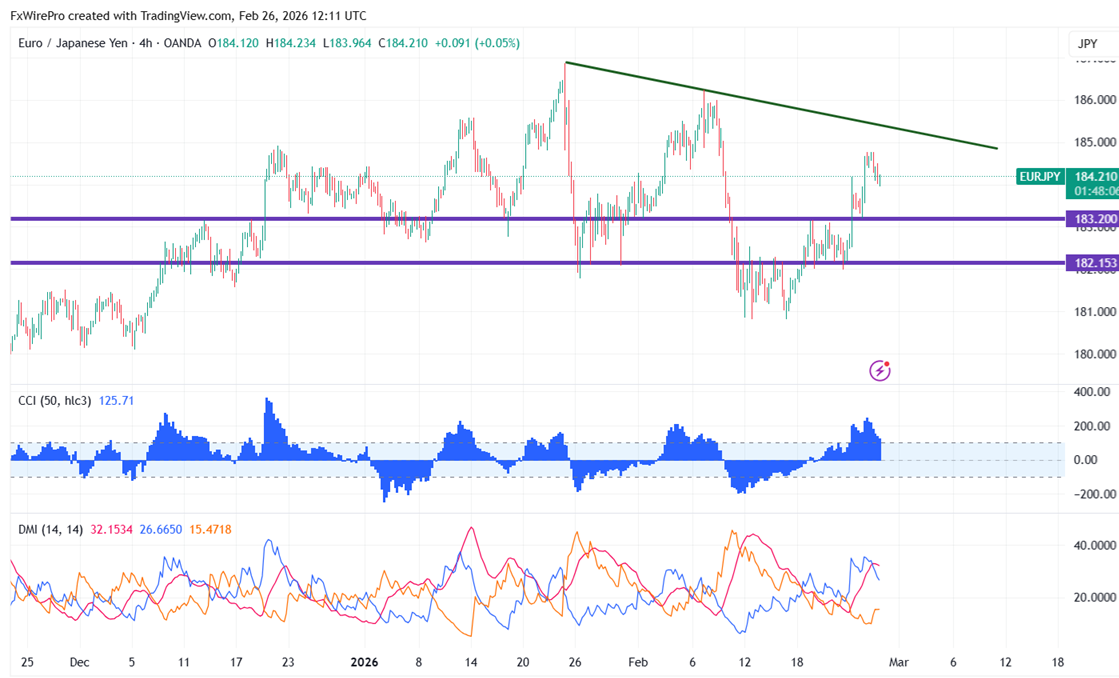
EURJPY shed some of its gains due to profit booking. It is still bullish as long as it is over 183.20 pairs. It now hovers around 184.23 after hitting an intraday peak of 184.71.
Technical Analysis:
The EUR/JPY pair is above 55 EMA, 200, and 365-H EMA on the 4-hour chart.
- Near-Term Resistance: Around 185,a breakout here could lead to targets at 186/187/188.69.
- Immediate Support: At 183.20, if breached, the pair could fall to 182.80/182.48/181.80/180.80/180.
Indicator Analysis (4- hour chart): - CCI (50): Bullish
- Average Directional Movement Index: Neutral
Overall, the indicators suggest a bullish trend
Trading Recommendation:
It is good to buy on dips around 183.18-20 with a SL around 182.48 for a TP of 186.


