


 BTCUSD Coils in Tight Range: Will Geopolitical Stability Trigger a Breakout Toward $80,000?
  Ethereum Trails Bitcoin’s Retreat: Key Support Levels in Focus
  FxWirePro- Major Crypto levels and bias summary
  FxWirePro- Major Crypto levels and bias summary
  Bitcoin Retreats Toward Critical Support as Geopolitical Winds Shift
  FxWirePro- Major Crypto levels and bias summary


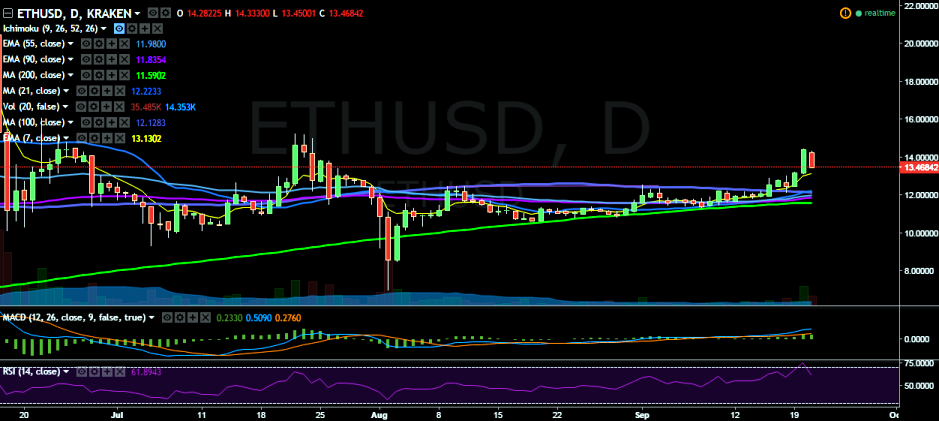
ETH/USD reversed its upward trend on Wednesday and is trading in the red. It has fallen below 14.00 mark, after hitting 14.45 levels and currently trades at 13.61 levels (Kraken).
Long-term trend: Bullish
Short-term trend: Bullish
Ichimoku analysis of daily chart:
Tenkan Sen: 13.06
Kijun Sen: 12.64
Trend reversal: 11.79 (90 EMA)
“The pair has declined after hitting 14.45 levels, however, the overall trend remains bullish”, FxWirePro said in a statement.
The pair is trading above 13.01 levels (7-EMA) and will run into resistance at 14.45 (September 20 high). A break above would see the pair testing 15.23 levels (July 22 high)/16.08 (June 22 high)/.
On the flip side, a break below 13.00 levels would see a dip till 12.17 (100 DMA). Further weakness would drag the pair to 11.79 (90 EMA)/11.57 (200 DMA).

- News

- Economy

- Central Banks
- Investing
- Research
- Roundups
- Digital Currency
- Insights
- Technical Analysis
- Technology
- Business
- Law
- Health
- Nature
- Fintech
- Science
- Topic
- Opinions
- ©Econometrics LLC . All Rights Reserved.
ETH/USD turns red, likely to find support near 7-EMA
Wednesday, September 21, 2016 11:21 AM UTC
Editor's Picks


- Market Data
Most Popular


