


 Bitcoin Surges Past $85,000 Amidst Rising Risk Appetite
  FxWirePro- Major Crypto levels and bias summary
  FxWirePro-24-Hour Crypto Category-Based Performance Dashboard
  FxWirePro- Major Crypto levels and bias summary


 Add as a preferred source on Google
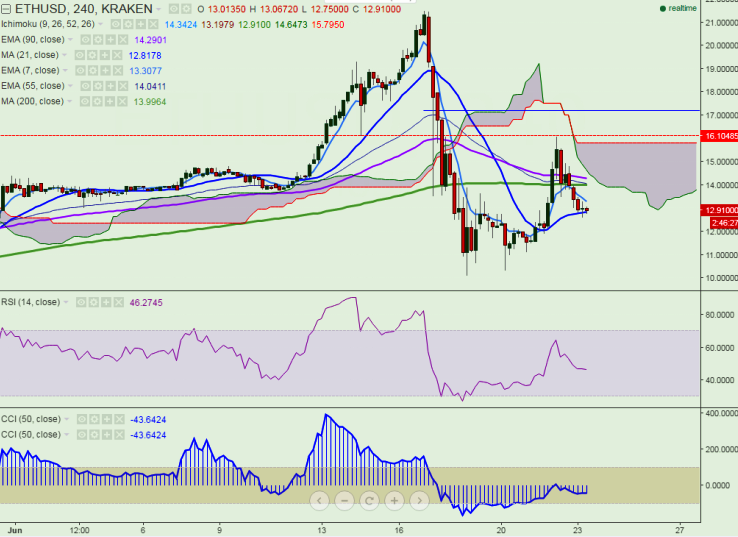
ETH/USD failed to hold its levels seen on Wednesday and turned red, falling to 12.60 levels. It currently trades at 12.83 levels at the time of writing (Kraken).
Ichimoku analysis (4 H chart):
Tenkan-Sen level: $14.10
Kijun-Sen level: $13.19
Trend reversal level - (90 4H EMA)-$14.32
“The pair has declined sharply after making a high of $16.08. In 4hour chart ETH/USD is trading well below Tenkan-Sen and Kijun-Sen. So once again decline till $10 is possible”, FxWirePro said in a statement.
Long-term trend is bullish for the pair and it will face a major resistance at $13.45 (7 4H EMA) and any break above that level will take the pair till $14.32/$14.75 (61.8% retracement of $10.10 and $16.08).
Short-term trend, however, is bearish and ETH/USD faces short-term support at $12.78 (21 4H MA) and any violation below will drag the pair till $11.10/$10.10 (18 Jun low).

- News

- Economy

- Central Banks
- Investing
- Research
- Roundups
- Digital Currency
- Insights
- Technical Analysis
- Technology
- Business
- Law
- Health
- Nature
- Fintech
- Science
- Topic
- Opinions
- ©Econometrics LLC . All Rights Reserved.
ETH/USD turns red, decline till $10 likely
Thursday, June 23, 2016 9:34 AM UTC
Editor's Picks



- Market Data
Most Popular




