


 FxWirePro- Major Crypto levels and bias summary
  FxWirePro- Major Crypto levels and bias summary
  FxWirePro- Major Crypto levels and bias summary
  BTCUSD Coils in Tight Range: Will Geopolitical Stability Trigger a Breakout Toward $80,000?
  Bitcoin Retreats as Geopolitical Tensions Flare: BTC/USD Dips Following Iran’s Rejection of Ceasefire
  Bitcoin Retreats Toward Critical Support as Geopolitical Winds Shift
  Ethereum Trails Bitcoin’s Retreat: Key Support Levels in Focus
  Ethereum’s $2,200 Ceiling: Can Diplomatic Breakthroughs Dissolve the Bearish Resistance?


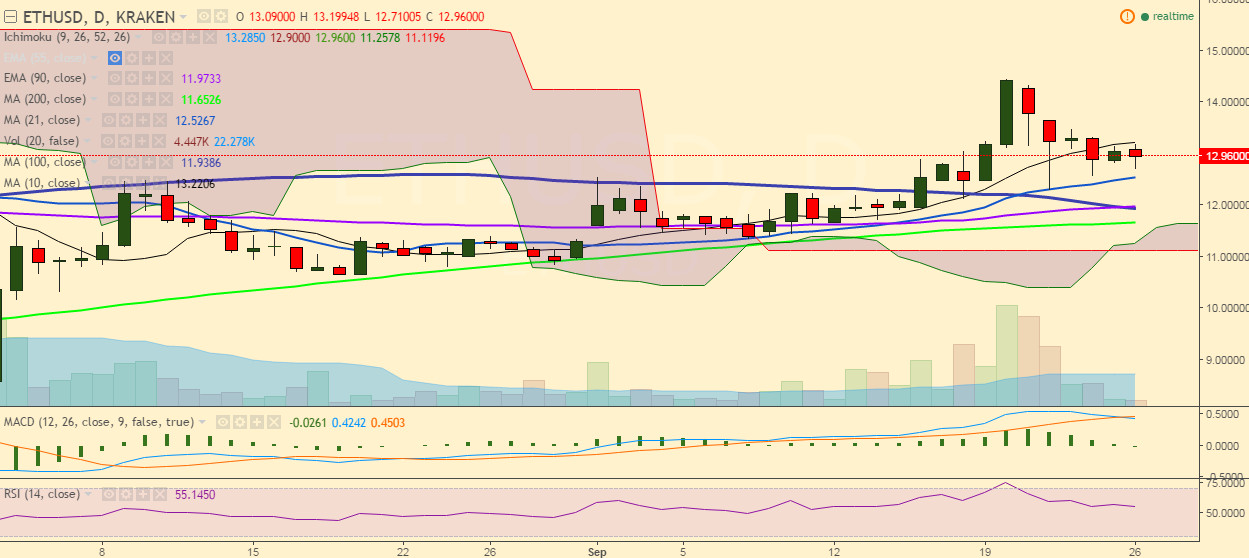
ETH/USD is trading in red on Monday and has hit 12.71 levels before restoring to 12.96 levels, where it currently trades (Kraken).
Long-term trend: Bullish
Ichimoku analysis of daily chart:
Tenkan Sen: 13.28
Kijun Sen: 12.70
Trend reversal: 11.95 (90 EMA)
“The pair is facing minor resistance at 13.17 (10-day MA) and should break above September 20 high of 14.45 levels for further upside”, FxWirePro said in a statement.
ETH/USD faces major resistance 14.45 (September 20 high) and a break above would target 15.23 levels (July 22 high)/16.08 (June 22 high).
On the downside, support is likely to be found at 12.47 (21 DMA) and a break below would weaken the pair to 12.30 (September 22 low)/11.95 (90 EMA).

- News

- Economy

- Central Banks
- Investing
- Research
- Roundups
- Digital Currency
- Insights
- Technical Analysis
- Technology
- Business
- Law
- Health
- Nature
- Fintech
- Science
- Topic
- Opinions
- ©Econometrics LLC . All Rights Reserved.
ETH/USD faces resistance at 10-DMA, bullishness only above 14.45
Monday, September 26, 2016 11:40 AM UTC
Editor's Picks


- Market Data
Most Popular


