


 FxWirePro- Major Crypto levels and bias summary


 resumes weakness, break below 20-DMA could see fresh multi-month lows - EconoTimes)


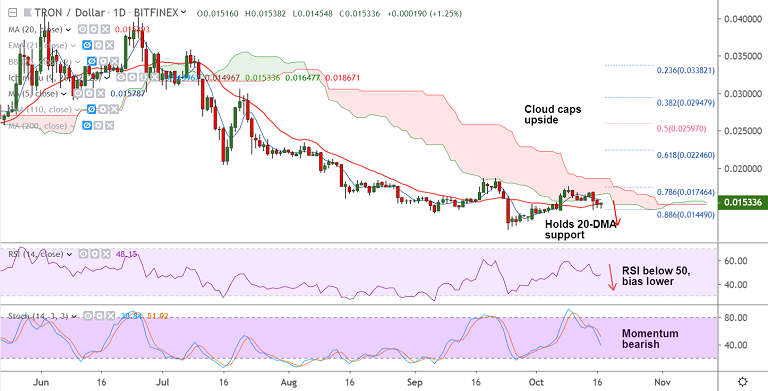
TRX/USD chart - Trading View
Exchange - Bitfinex
Support: 0.014490 (88.6% Fib); Resistance: 0.016547 (55-EMA)
Technical Analysis: Bias bearish
TRON (TRX) has been extending gradual grind lower after upside was capped at daily cloud.
Technical indicators on the daily charts are biased lower. RSI below 50 and stochs are sharply lower.
5-DMA has turned indicating near-term downside. TRX/USD is holding support at 20-DMA (0.015291).
Break below 20-DMA will see resumption of downside. Test of fresh multi-month lows likely.
Failure to break below 20-DMA could see further consolidation. Breakout above cloud will invalidate any bearish bias.


