


 FxWirePro- Major Crypto levels and bias summary


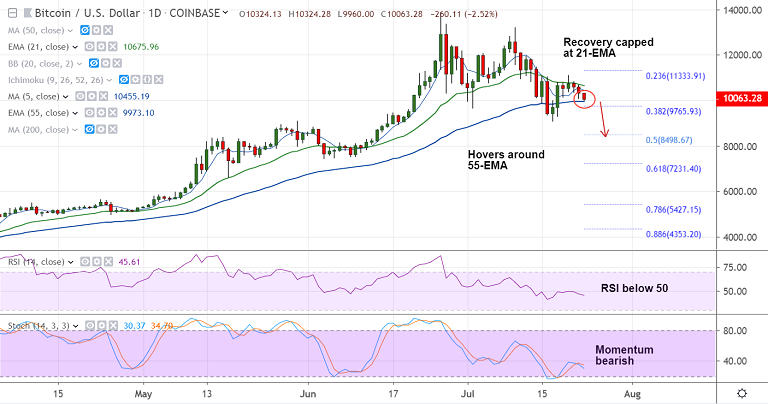
BTC/USD chart - Trading View
Exchange - Coinbase
Technical Analysis: Bias Bearish
Support: 9972 (55-EMA), 9339 (Lower BB), 8606 (110-EMA)
Resistance: 10455 (5-DMA), 10675 (21-EMA), 10970 (20-DMA)
BTC/USD trades 2.55% weaker on the day at 10060 at 08:20 GMT.
Recovery attempts in the pair have fizzled out at 21-EMA which is strong resistance.
The pair is extending weakness for the 3rd straight session, intraday bias is turning bearish.
Price action is currently holding support at 55-EMA at 9972. Break below will see further weakness.
Technical indicators on the intraday charts support weakness. RSI has slipped below 50 and Stochs show bearish momentum.
Break below 55-EMA will see dip till 110-EMA at 8605 ahead of 50% Fib at 8498.
For details on FxWirePro's Currency Strength Index, visit http://www.fxwirepro.com/currencyindex.


