


 Goldman Sachs Sees U.S. Dollar Holding Firm as Strong Economic Data Supports Outlook
  SpaceX Stock Gets $175 Target as Analysts See Massive Growth Ahead
  Gold Tumbles Below $4,400 on NFP Shock: Fed Easing Bets Crater, Sell on Rallies to $4,300
  AI Memory Boom Sparks Global Chip Supply Crunch
  Goldman Sachs Sees Fed Holding Interest Rates Steady Until 2027
  J.P. Morgan Sees Potential Vestas Guidance Upgrade Amid Strong Wind Energy Demand
  Trump’s Iran Strategy: What Has Been Achieved After Three Months of Conflict?


 - EconoTimes)


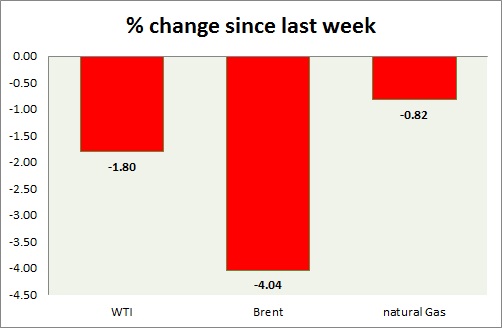
Energy pack is mixed today, while oil is down, gas is up. Weekly performance at a glance in chart & table.
Oil (WTI) -
- WTI is trying to pose a comeback, however struggling since sellers still remain large enough to push prices lower. Today's range $41.7-40.5
- Higher inventory dents confidence of bulls this week.
- WTI is currently trading at $41.4/barrel. Immediate support lies at $42-40 area and resistance at $47-49 area.
Oil (Brent) -
- Brent is worse performer than WTI today. Today's range - $47.4-46.3.
- Brent-WTI spread dropped to $5.4/barrel, further contraction likely.
- Brent is trading at $46.8/barrel. Immediate support lies at $45 area and resistance at $53 region.
Natural Gas -
- Natural gas bulls successfully defended range floor around $2.7/mmbtu over both FOMC minutes and inventory data from EIA today. Today's range $2.69-2.79.
- Stocks rose by 53 billion cubic feet compared to 65 billion cubic feet prior.
- Price might reach as $2.95 area since bulls were able to maintain floor.
- Natural Gas is currently trading at $2.78/mmbtu. Immediate support lies at $2.7, $2.55, $2.45 area & resistance at $2.95, $3.04, $3.32.
|
WTI |
-1.80% |
|
Brent |
-4.04% |
|
Natural Gas |
-0.82% |


