


 Wall Street Futures Slip After Record Rally Fueled by Iran Peace Hopes and AMD Surge
  Lula and Trump Talks Signal New Phase in Brazil-US Relations
  China Export Growth Surges in April as Global Buyers Rush to Secure Supplies
  Asian Stocks Rally as Japan’s Nikkei Hits Record High on U.S.-Iran Peace Optimism
  FxWirePro: Daily Commodity Tracker - 21st March, 2022
  Gold Prices Rise as Weaker Dollar and Iran Ceasefire Hopes Boost Safe-Haven Demand
  Trump Signals Possible U.S.-Iran Peace Deal as Markets Rally on Hopes of War Ending
  Wall Street Futures Edge Higher as Iran Tensions and AI Optimism Shape Markets
  Asian Currencies Slip as US Dollar Gains on Rising Iran Tensions and Awaited Jobs Data
  Japan Tech Stocks Surge as AI Optimism Lifts SoftBank, Chipmakers
  Japan’s Yen Intervention and BOJ Rate Hike Bets Support Currency Recovery


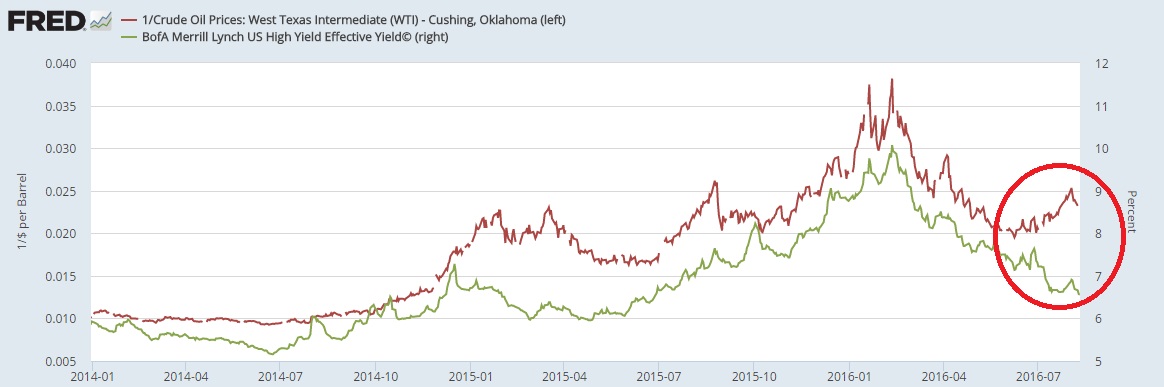
This chart made by us at FxWirePro, in St. Louis Fed's economic dashboard shows how the U.S. high yield bonds have gotten along with the crude oil price (inverse scale). How many barrels of crude a dollar buys vs. Effective yield calculated by Bank of America Merrill Lynch (BofAML).
Since 2015, they had have shown a very high level of intimacy, Crude went down, the yield went up. Both recovered since February.
However, recently these two, have diverged. the oil price edged lower but yields edged lower too. We wonder if the oil doesn't affect the financial position of the high yield companies anymore, the worst is over or is that the investors don't care? Just being crazy about the yield/return? And there will be no credit risk since the money printing is forever!!!


