


 FxWirePro: NZD/USD edges higher ahead of Jackson hole warsh speech
  Major Pair Currency Score: AUDUSD Extremely Bullish, NZDUSD Bullish
  Bitcoin Surges Past $79,000: ETF Inflows and Technicals Signal Strong Bullish Momentum
  FxWirePro: GBP/USD slips lower as dollar firms after Warsh comments
  Bitcoin Eyes $90K as $3B ETF Inflow Streak Overpowers Hawkish Fed
  FxWirePro: EUR/AUD outlook weaker on renewed downside pressure
  FxWirePro: GBP/AUD dips below 1.9000 level , vulnerable to more downside
  JPY Major Currency Score: NZDJPY and AUDJPY Lead with Extremely Bullish Momentum
  FxWirePro- Major Crypto levels and bias summary


 Add as a preferred source on Google
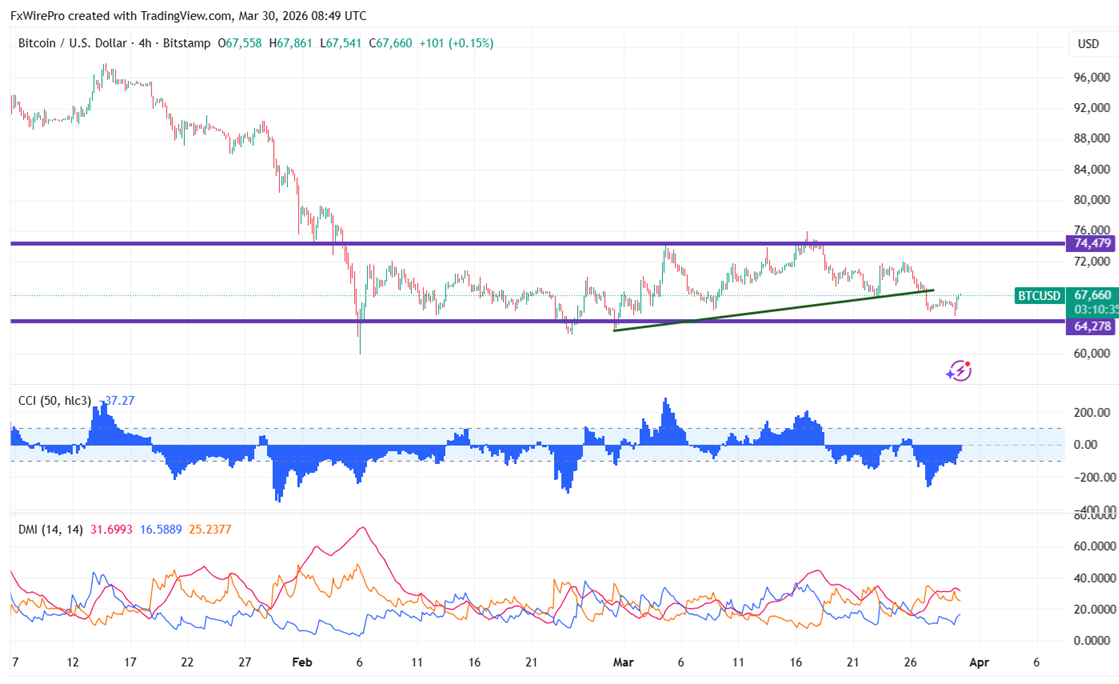
As geopolitical tension between the US and Iran rises, BTCUSD trades erratically. It dropped to an intraday low of $64,955 and is currently trading at about $67,712.
|
Technicals |
CMP -$67637 |
Trend |
|
|
4- Hour chart |
Value |
|
|
|
55 EMA |
$68451 |
CMP< 55 EMA |
Bearish |
|
200- EMA |
$69964 |
CMP <200- EMA |
Bearish |
|
365- EMA |
$72636 |
CMP <365 EMA |
Bearish |
Major support- $64000/$60000/$52500/$50000. Minor bullishness only above $72500. Any break above targets $74500/$76200/$80000/$85500.
|
Momentum indicator (4-hour chart) |
Inference |
Value |
|
CCI(50) |
Bearish |
-48.53 |
|
ADX |
Neutral |
|
It is good to buy on dips around $67000 with SL around $64000 for a TP of $80000.







