


 FxWirePro- Major Pair levels and bias summary
  AUDJPY Surges to One-Month High on Australian Dollar Strength
  Bitcoin Surges Past $79,000: ETF Inflows and Technicals Signal Strong Bullish Momentum
  NZDJPY Holds 95 Amidst Buying Pressure, Technicals Point to Potential Downtrend
  FxWirePro: NZD/USD edges higher ahead of Jackson hole warsh speech
  FxWirePro: USD/JPY trades flat ahead of Warsh's policy signals
  Bitcoin Eyes $90K as $3B ETF Inflow Streak Overpowers Hawkish Fed


 Add as a preferred source on Google
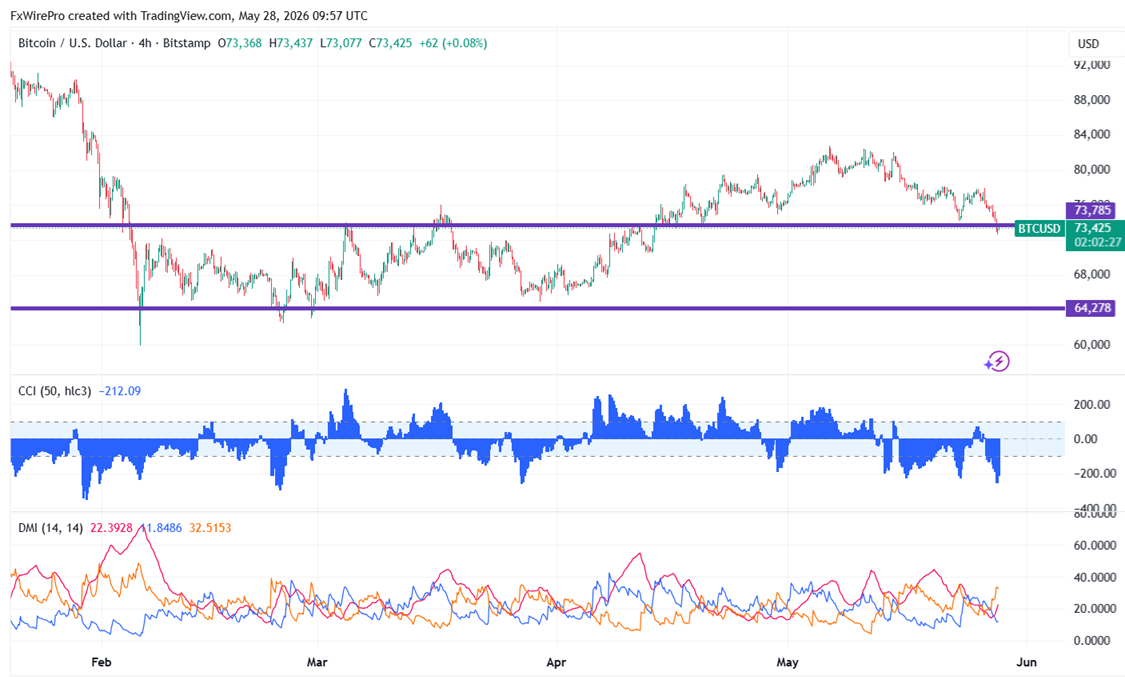
BTCUSD lost its shine on Middle East tension escalation and weak institutional demand. It has dropped to $72622 and is now trading at about $73437.
|
Technicals |
CMP -$73500 |
Trend |
|
|
4- Hour chart |
Value |
|
|
|
55 EMA |
$76488 |
CMP<55 EMA |
Bearish |
|
200- EMA |
$77192 |
CMP <200- EMA |
Bearish |
|
365- EMA |
$76383 |
CMP<365 EMA |
Bearish |
Major support- $72000/$70000/$67000/$64000/$60000. Minor bullishness only above $78000. Any break above targets $80000/$82000/$85890/$90000.
|
Momentum indicator (4-hour chart) |
Inference |
Value |
|
CCI(50) |
Bearish |
-250.22 |
|
ADX |
Neutral |
Strength increased from 14.65 to 20.53 |
It is good to sell on rallies around $75000, with an SL around $78000, for a TP of $70000/$67000.







