


 Ethereum Trails Bitcoin’s Retreat: Key Support Levels in Focus
  Ethereum’s $2,200 Ceiling: Can Diplomatic Breakthroughs Dissolve the Bearish Resistance?
  Ethereum Steady Above USD 2,000: ETH Tracks Bitcoin’s Lead as Bulls Eye a USD 2,770 Breakout
  Ethereum Retreats in Bitcoin’s Shadow: ETH/USD Tests Critical Support at USD 2,075
  FxWirePro- Major Crypto levels and bias summary
  BTCUSD Coils in Tight Range: Will Geopolitical Stability Trigger a Breakout Toward $80,000?
  FxWirePro- Major Crypto levels and bias summary
  Bitcoin Retreats Toward Critical Support as Geopolitical Winds Shift


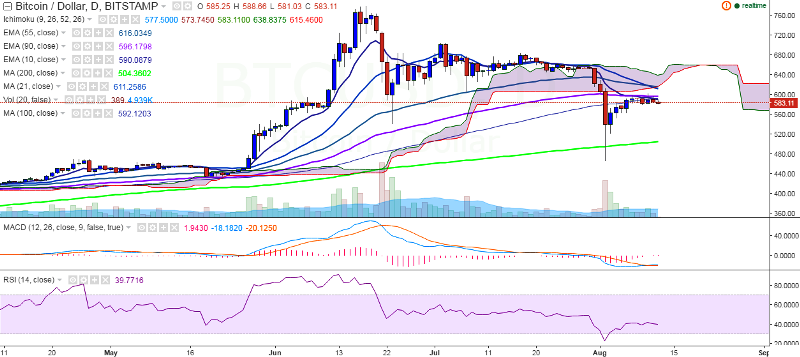
BTC/USD continues to trade in the red on Friday. The pair’s upward move seems to be limited by 90 EMA. It currently trades at 581.55 levels at the time of writing (Bitstamp).
Ichimoku analysis of daily chart:
Tenkan Sen: 562
Kijun Sen: 574.73
Trend reversal: 596.47 (90 EMA)
The pair broke above 90 EMA briefly on Wednesday, hitting 603 levels. However, it failed to hold it strength and declined to 581 levels. A close above this trend line (90 EMA) would confirm further bullishness in the pair.
On the topside, major resistance is seen at 596.47 (90 EMA) and a break above would see the pair testing 614.44 (21 MA)/650. On the flipside, support is seen at 540 (June 23 low) and any weakness below this level would drag the pair to 503.39 (200 MA)/465.28 (Aug 2 low).

- News

- Economy

- Central Banks
- Investing
- Research
- Roundups
- Digital Currency
- Insights
- Technical Analysis
- Technology
- Business
- Law
- Health
- Nature
- Fintech
- Science
- Topic
- Opinions
- ©Econometrics LLC . All Rights Reserved.
BTC/USD upside capped by 90 EMA, further bullishness only above the level
Friday, August 12, 2016 4:12 AM UTC
Editor's Picks


- Market Data
Most Popular


