


 BTCUSD Coils in Tight Range: Will Geopolitical Stability Trigger a Breakout Toward $80,000?
  Bitcoin Retreats Toward Critical Support as Geopolitical Winds Shift
  Ethereum Trails Bitcoin’s Retreat: Key Support Levels in Focus
  FxWirePro- Major Crypto levels and bias summary
  FxWirePro- Major Crypto levels and bias summary


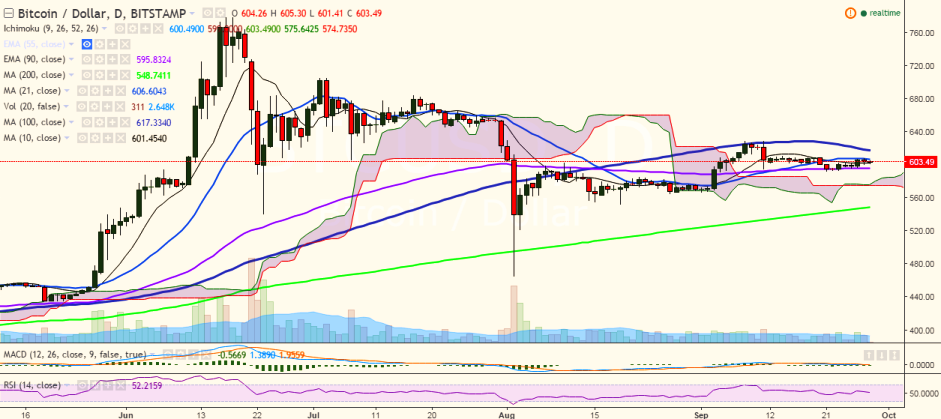
BTC/USD hit a fresh high of 608.37 levels on Tuesday but has failed to close above 21-DMA. It is currently trading at 603 levels.
Long-term trend: Bullish
Short-term trend: Bullish
Ichimoku analysis of daily chart:
Tenkan Sen: 600.80
Kijun Sen: 598.01
Trend reversal: 595.66 (90 EMA)
“BTC/USD is trading in a narrow range between 10- and 21-DMA. The short-term trend seems slightly bullish and the pair must break above 21-DMA for further upside”, FxWirePro said in a statement.
The pair is facing strong resistance at 607.16 (21-day MA) and a break above would see the pair testing 618.60 (100-DMA)/ 628 (September 11 high).
On the downside, the pair is holding its strength above 600 levels and any violation would target 595.66 (90 EMA)/547.77 (200-day MA).

- News

- Economy

- Central Banks
- Investing
- Research
- Roundups
- Digital Currency
- Insights
- Technical Analysis
- Technology
- Business
- Law
- Health
- Nature
- Fintech
- Science
- Topic
- Opinions
- ©Econometrics LLC . All Rights Reserved.
BTC/USD trades in narrow range, break above 21-DMA targets 618
Wednesday, September 28, 2016 7:18 AM UTC
Editor's Picks


- Market Data
Most Popular


