


 FxWirePro- Major Crypto levels and bias summary
  BTCUSD Coils in Tight Range: Will Geopolitical Stability Trigger a Breakout Toward $80,000?
  FxWirePro- Major Crypto levels and bias summary
  Bitcoin Retreats as Geopolitical Tensions Flare: BTC/USD Dips Following Iran’s Rejection of Ceasefire
  Ethereum Retreats in Bitcoin’s Shadow: ETH/USD Tests Critical Support at USD 2,075
  Ethereum Trails Bitcoin’s Retreat: Key Support Levels in Focus


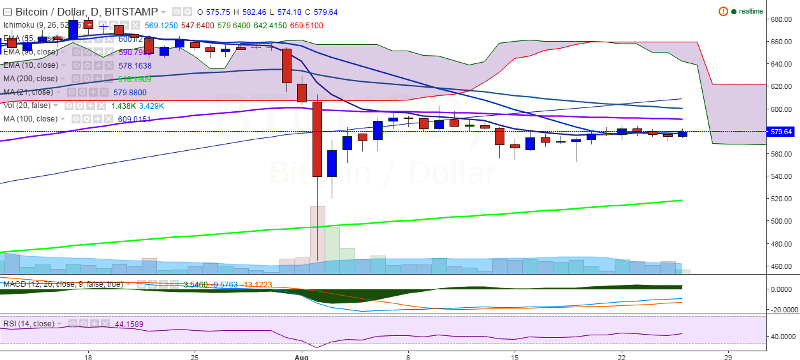
BTC/USD is hovering around 21-day MA and trading at 579.85 levels at the time of writing (Bitstamp). A close above this level would confirm minor bullishness in the pair.
Ichimoku analysis of daily chart:
Tenkan Sen: 569.12
Kijun Sen: 559.99
Trend reversal: 591 (90-day MA)
Long-term trend is bullish for the pair and it faces major resistance at 591 (90-day MA) and any violation will see it testing 607.74 levels/634 (161.8% retracement of 603 and 522.30).
On the other hand, support is likely to be found at 550 (psychological level) and any weakness would drag the pair to 517.14 (200-day MA)/465.28 (August 2 low).

- News

- Economy

- Central Banks
- Investing
- Research
- Roundups
- Digital Currency
- Insights
- Technical Analysis
- Technology
- Business
- Law
- Health
- Nature
- Fintech
- Science
- Topic
- Opinions
- ©Econometrics LLC . All Rights Reserved.
BTC/USD struggles to close above 21-day MA, bullishness only above 600
Friday, August 26, 2016 9:23 AM UTC
Editor's Picks


- Market Data
Most Popular


