


 FxWirePro- Major Crypto levels and bias summary
  Ethereum Steady Above USD 2,000: ETH Tracks Bitcoin’s Lead as Bulls Eye a USD 2,770 Breakout
  Ethereum Retreats in Bitcoin’s Shadow: ETH/USD Tests Critical Support at USD 2,075
  Bitcoin Retreats as Geopolitical Tensions Flare: BTC/USD Dips Following Iran’s Rejection of Ceasefire


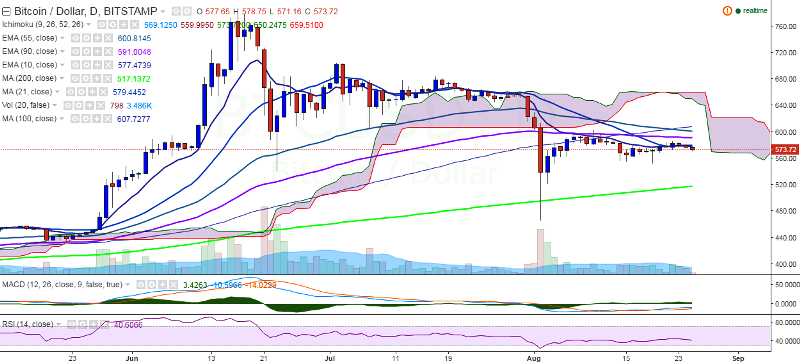
BTC/USD weakened further on Thursday and continues to trade in the red at 573.67 levels at the time of writing (Bitstamp).
Long-term trend: Bullish
Ichimoku analysis of daily chart:
Tenkan Sen: 569.12
Kijun Sen: 561.39
Trend reversal: 591.39 (90-day EMA)
“BTC/USD has declined after making a high of 585.95 levels (August 22 high) and is trading well below 21-day MA. The pair will resume uptrend only above 90-day EMA”, FxWirePro said in a statement.
Major resistance is seen at 591.39 (90-day EMA) and a break above would target 606.52 (100-day MA)/ /634 (161.8% retracement of 603 and 522.30).
On the flipside, the pair may find support at 550 (psychological level) and break below would send the pair to 514 (200-day MA)/465.28 (August 2 low).

- News

- Economy

- Central Banks
- Investing
- Research
- Roundups
- Digital Currency
- Insights
- Technical Analysis
- Technology
- Business
- Law
- Health
- Nature
- Fintech
- Science
- Topic
- Opinions
- ©Econometrics LLC . All Rights Reserved.
BTC/USD plunges further, dip till 550 likely
Thursday, August 25, 2016 7:15 AM UTC
Editor's Picks


- Market Data
Most Popular


