


 Ethereum’s $2,200 Ceiling: Can Diplomatic Breakthroughs Dissolve the Bearish Resistance?
  Ethereum Retreats in Bitcoin’s Shadow: ETH/USD Tests Critical Support at USD 2,075
  FxWirePro- Major Crypto levels and bias summary
  Ethereum Steady Above USD 2,000: ETH Tracks Bitcoin’s Lead as Bulls Eye a USD 2,770 Breakout


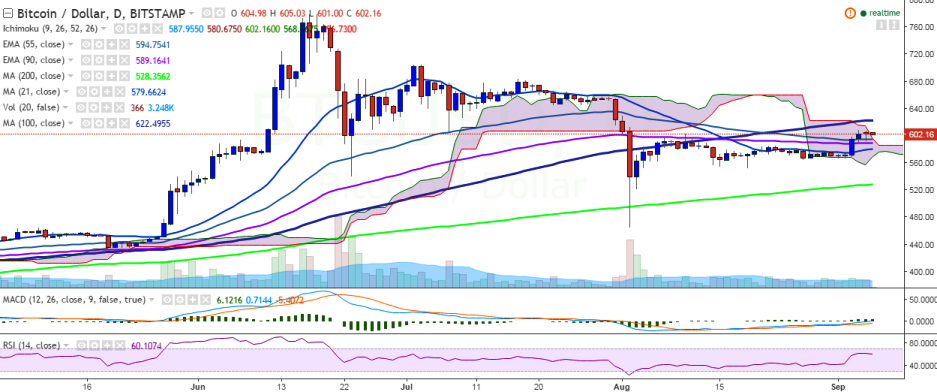
BTC/USD is showing a slight dip after hitting 609 levels and is currently trading at 602 levels at the time of writing (Bitstamp).
Long-term trend: Bullish
Ichimoku analysis of daily chart:
Tenkan Sen: 587.92
Kijun Sen: 580.67
Trend reversal: 588.87 (90 EMA)
The pair is trying to hold its strength above the 600.00 mark. On the upside, it faces major resistance at 621.65 (100-day MA) and a break above would target 653.69 (78.6% retracement of 704.99 and 465.28)/ 705 (July 3 high).
On the other hand, support is seen at 588.87 (90 EMA), and any weakness below this level would drag the pair to 550/ 527.44 (200-day MA).

- News

- Economy

- Central Banks
- Investing
- Research
- Roundups
- Digital Currency
- Insights
- Technical Analysis
- Technology
- Business
- Law
- Health
- Nature
- Fintech
- Science
- Topic
- Opinions
- ©Econometrics LLC . All Rights Reserved.
BTC/USD hovers around 600, eyes 650
Tuesday, September 6, 2016 6:47 AM UTC
Editor's Picks


- Market Data
Most Popular


