


 FxWirePro- Major Crypto levels and bias summary
  Ethereum Steady Above USD 2,000: ETH Tracks Bitcoin’s Lead as Bulls Eye a USD 2,770 Breakout
  Ethereum Trails Bitcoin’s Retreat: Key Support Levels in Focus
  Bitcoin Retreats Toward Critical Support as Geopolitical Winds Shift
  FxWirePro- Major Crypto levels and bias summary
  FxWirePro- Major Crypto levels and bias summary


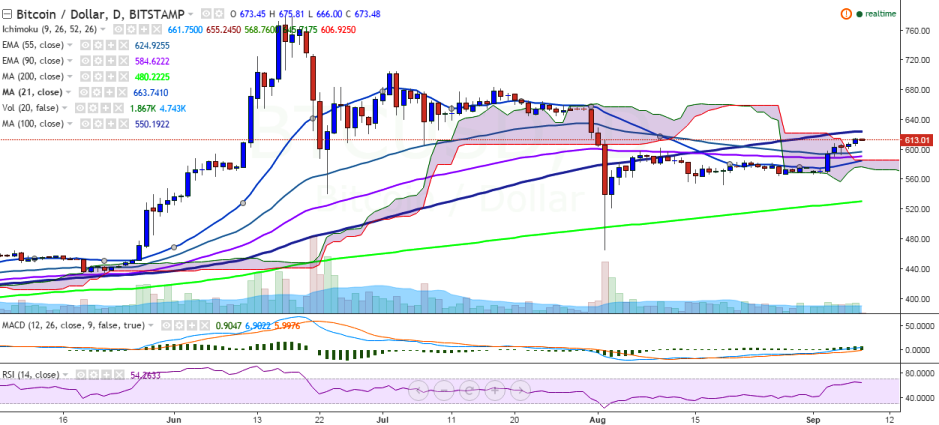
BTC/USD is continuing its upward trend and looking to break above 100-day MA. The pair hit a fresh high of 615.92 levels on Wednesday and is currently trading at 613.98 levels at the time of writing (Bitstamp).
Long-term trend: Bullish
Short-term trend: Bullish
Ichimoku analysis of daily chart:
Tenkan Sen: 591.39
Kijun Sen: 584.11
Trend reversal: 589.97 (90 EMA)
“The pair appears to be determined to break above 625 levels. A close above 100-day MA would see further jump till 700 levels”, FxWirePro said in a statement.
The pair will run into resistance at 623.48 (100-day MA) and a break above would see the pair reaching 653.69 (78.6% retracement of 704.99 and 465.28)/ 705 (July 3 high).
On the flipside, support is seen at 589.97 (90 EMA), and a break below would drag the pair to 550/ 529.31 (200-day MA).

- News

- Economy

- Central Banks
- Investing
- Research
- Roundups
- Digital Currency
- Insights
- Technical Analysis
- Technology
- Business
- Law
- Health
- Nature
- Fintech
- Science
- Topic
- Opinions
- ©Econometrics LLC . All Rights Reserved.
BTC/USD continues uptrend, likely to break above 100-day MA
Thursday, September 8, 2016 7:21 AM UTC
Editor's Picks


- Market Data
Most Popular


