


 Ethereum Retreats in Bitcoin’s Shadow: ETH/USD Tests Critical Support at USD 2,075
  Bitcoin Retreats as Geopolitical Tensions Flare: BTC/USD Dips Following Iran’s Rejection of Ceasefire
  Ethereum Steady Above USD 2,000: ETH Tracks Bitcoin’s Lead as Bulls Eye a USD 2,770 Breakout
  Ethereum’s $2,200 Ceiling: Can Diplomatic Breakthroughs Dissolve the Bearish Resistance?
  FxWirePro- Major Crypto levels and bias summary


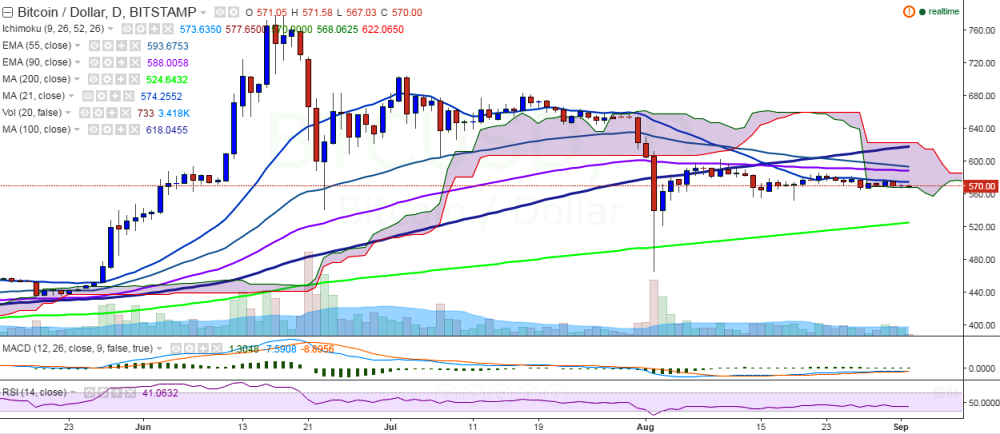
BTC/USD is trading in a choppy range on Friday, continuing the pattern seen for the rest of the week. It is currently trading at 568 levels at the time of writing (Bitstamp).
Ichimoku analysis of daily chart:
Tenkan Sen: 573.63
Kijun Sen: 577.65
Trend reversal: 588.41 (90 EMA)
Short-term trend remains weak for the pair as it has failed to close above 21-day MA from past couple of days. A break above this trend line would target 588.41 (90 EMA) and further strength would take it to 603 (August 10 high).
On the reverse side, support is likely to be found around 550 (psychological level) and break below would target $540 (38.2% retracement of $465 and $583)/ $523.10 (200 day MA).

- News

- Economy

- Central Banks
- Investing
- Research
- Roundups
- Digital Currency
- Insights
- Technical Analysis
- Technology
- Business
- Law
- Health
- Nature
- Fintech
- Science
- Topic
- Opinions
- ©Econometrics LLC . All Rights Reserved.
BTC/USD continues choppy trade, bullishness only above 600
Friday, September 2, 2016 10:54 AM UTC
Editor's Picks


- Market Data
Most Popular


