


 Bitcoin Retreats Toward Critical Support as Geopolitical Winds Shift
  FxWirePro- Major Crypto levels and bias summary
  Ethereum Trails Bitcoin’s Retreat: Key Support Levels in Focus
  Ethereum Retreats in Bitcoin’s Shadow: ETH/USD Tests Critical Support at USD 2,075
  Bitcoin Retreats as Geopolitical Tensions Flare: BTC/USD Dips Following Iran’s Rejection of Ceasefire
  FxWirePro- Major Crypto levels and bias summary
  FxWirePro- Major Crypto levels and bias summary


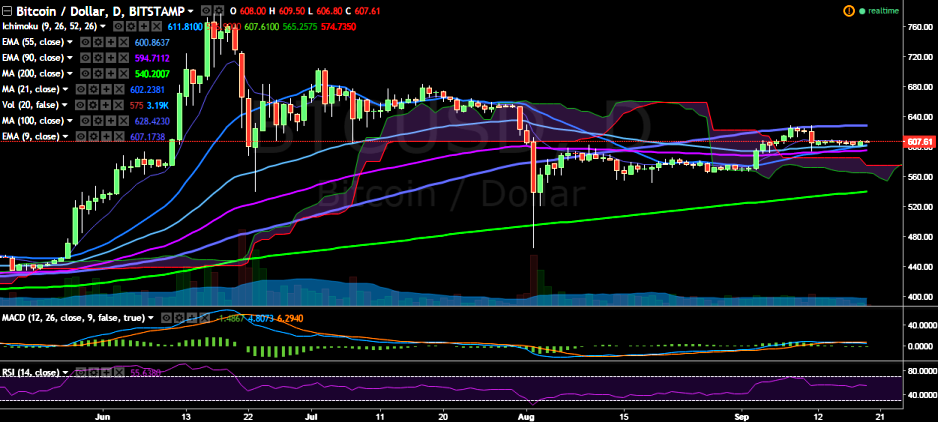
BTC/USD successfully maintained its strength above the 600 mark last week. (Bitstamp). The pair’s upside is being capped by 9 EMA, however, it is trading slightly above this level at 608 levels at the time of writing (Bitstamp).
Long-term trend: Bullish
Ichimoku analysis of daily chart:
Tenkan Sen: 611.81
Kijun Sen: 596.90
Trend reversal: 594.42 (90 EMA)
“BTC/USD managed to close slightly above 9-EMA on September 18, which suggests scope for further upside. Bullishness could be confirmed only above 628 levels (100 DMA)”, FxWirePro said in a statement.
Major resistance is seen at 628.44 (100-day) and any violation would see the pair testing 653.69 (78.6% retracement of 704.99 and 465.28)/ 705 (July 3 high).
On the downside, a break below 600 levels will see a small dip till 594.42 (90 EMA)/ 547.14 (50% retracement of 465.28 and 628.99)/ 539.26 (200-day MA).

- News

- Economy

- Central Banks
- Investing
- Research
- Roundups
- Digital Currency
- Insights
- Technical Analysis
- Technology
- Business
- Law
- Health
- Nature
- Fintech
- Science
- Topic
- Opinions
- ©Econometrics LLC . All Rights Reserved.
BTC/USD breaks above 9-EMA, targets 630
Monday, September 19, 2016 7:42 AM UTC
Editor's Picks


- Market Data
Most Popular


