


 Crypto Alpha Command: BTC & ETH derivatives Intelligence
  FxWirePro- Major Crypto levels and bias summary
  FxWirePro- Major Crypto levels and bias summary
  ETHUSD Surges Past $2700 on Strong Institutional Demand, Technicals Show Bullish Crossover Despite Cooling ETF Inflow Momentum


 Add as a preferred source on Google
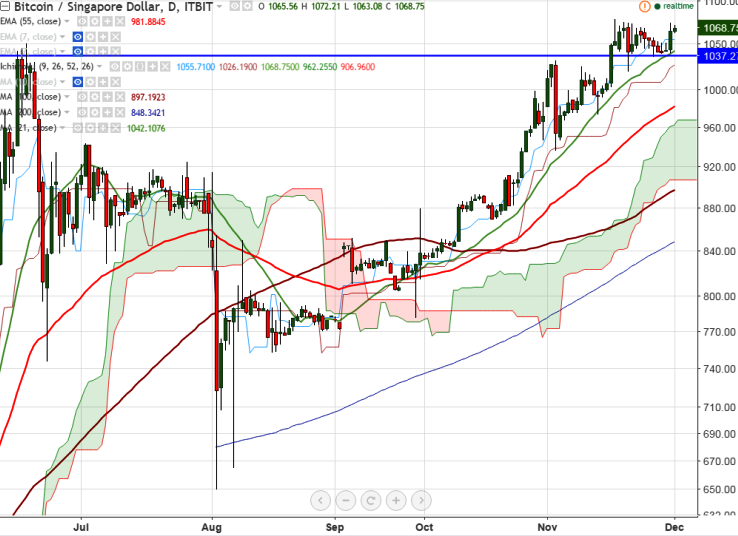
BTC/SGD is seen trading well above on Thursday. The pair has jumped once again till 1075 and slightly declined from that level (ITBIT). It is currently trading around 1071.18 at the time of writing.
Ichimoku analysis of daily chart shows:
Tenkan-Sen level: 1055.70
Kijun-Sen level: 1023.30
Trend reversal level - (100 days MA) – 894.48
Long-term trend remains to be bullish. BTC/SGD faces strong resistance at 1078 and any break above confirms minor bullishness.
Major resistance is around 1080 (Nov 17th 2016 high) and any break above that level will take the pair to next level till 1090 (161.8% retracement of 1031.92 and 936.20)/1160 (127.2% retracement of 1051.92 and 650)/1204 (138.2% retracement of 1051.92 and 650). Short-term support is seen at 1055 (daily Tenken-Sen) and any break below targets 1039 (21- day MA)/1023 (daily Kijun-Sen)/973 (Nov 13th 2016 low).

- News

- Economy

- Central Banks
- Investing
- Research
- Roundups
- Digital Currency
- Insights
- Technical Analysis
- Technology
- Business
- Law
- Health
- Nature
- Fintech
- Science
- Topic
- Opinions
- ©Econometrics LLC . All Rights Reserved.
BTC/SGD faces strong resistance at 1078, break above targets 1160
Thursday, December 1, 2016 11:27 AM UTC
Editor's Picks



- Market Data
Most Popular




