


 Bitcoin Surges Past $85,000 Amidst Rising Risk Appetite


 Add as a preferred source on Google
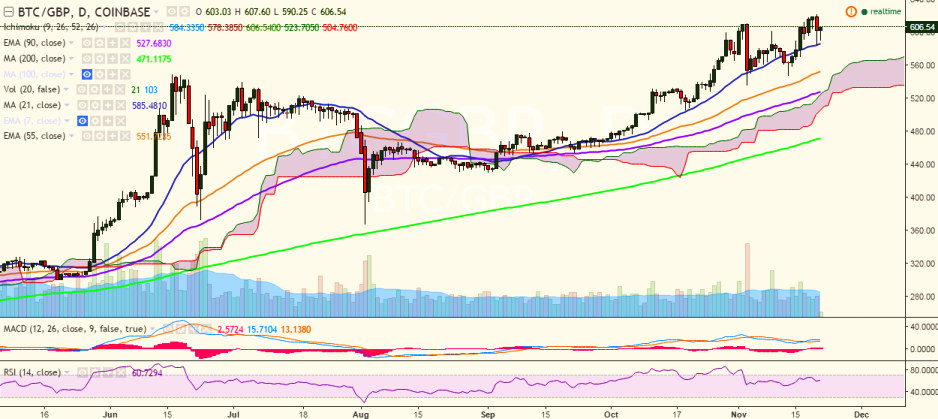
BTC/GBP fell to 583 levels after it hit a fresh high of 621.47 levels on November 20. It has restored its strength above the 600 mark and is currently trading at 606 levels at the time of writing (Coinbase).
Long-term trend: Bullish
Short-term trend: Bullish
Ichimoku analysis of daily chart:
Tenkan Sen: 584.33
Kijun Sen: 577.95
Trend reversal: 525.91 (90 EMA)
On the topside, resistance is seen at 621 levels (November 20 high) and a break above would target 628 (127.2% retracement of 611.12 and 547.20)/ 650.
On the downside, the pair has taken support near 583.93 (21-day MA) and a break below would weaken it to 568.22 (61.8% retracement of 535.30 and 621.47)/ 547.20 (November 13).

- News

- Economy

- Central Banks
- Investing
- Research
- Roundups
- Digital Currency
- Insights
- Technical Analysis
- Technology
- Business
- Law
- Health
- Nature
- Fintech
- Science
- Topic
- Opinions
- ©Econometrics LLC . All Rights Reserved.
BTC/GBP faces resistance at 621, break above targets 650
Monday, November 21, 2016 11:13 AM UTC
Editor's Picks



- Market Data
Most Popular




