


 Elon Musk’s Empire: SpaceX, Tesla, and xAI Merger Talks Spark Investor Debate
  JPMorgan Lifts Gold Price Forecast to $6,300 by End-2026 on Strong Central Bank and Investor Demand
  Nasdaq Proposes Fast-Track Rule to Accelerate Index Inclusion for Major New Listings
  BTC Flat at $89,300 Despite $1.02B ETF Exodus — Buy the Dip Toward $107K?


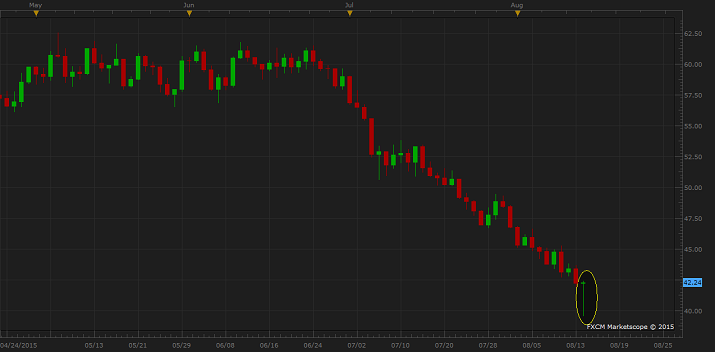
Today's sharp fall and equally sharp bounce back created is on the process of creating a unique candle in WTI daily chart, which makes today's final closing extremely pivotal in judging further moves ahead.
WTI is in the process of creating in very long legged Doji (Dragonfly) or long legged hammer in daily chart, both of which if appears after sharp downfall is considered as very strong bullish reversal signal.
The pattern will form if WTI is able to close today around $42.1-$42.2, which will form the doji or closing at high, which would form a hammer.
Though it definitely pays off to trade with the fundamental, which is supply glut as of now but these short term signals, derived from Japanese candle sticks should not be ignored.
Trading idea -
- WTI has reached all our targets ($55, 51, 46, 42), since short call was provided around $60 area. So with no positions we are ready to recommend short term buy if the above candles take form.
- To confirm the pattern a PDH (previous day high) break is required. However we stand ready to be little aggressive and stands ready to buy with $39.5/barrel as stop at lower price if the above mentioned candles are formed.


