


 FxWirePro- Major Crypto levels and bias summary
  FxWirePro: GBP/USD hits one-month high, scope for further upside
  AUDJPY Bullish Surge: Strong Australian Dollar Fuels Fresh Upside as Pair Holds Above 113.50 and All EMAs Align
  FxWirePro: GBP/NZD gains some upside momentum but still bearish
  FxWirePro: USD/JPY uptrend loses steam, remains on bullish path
  Gold Loses Steam After Strong U.S. Retail Sales
  FxWirePro: NZD/USD trades in narrow range ,outlook bullish
  FxWirePro:EUR/NZD dips below lower range, bearish bias increases
  FxWirePro: EUR/AUD outlook weaker on renewed downside pressure
  ETH Stands Alone Bullish; BTC, SOL, XRP, BNB Neutral
  FxWirePro- Woodies pivot (Major)
  FxWirePro: GBP/USD under pressure despite UK's modest economic growth
  JPY Action Bias: Extremely Bullish Surge Ignites Across NZD, GBP & AUD
  FxWirePro- Major Crypto levels and bias summary


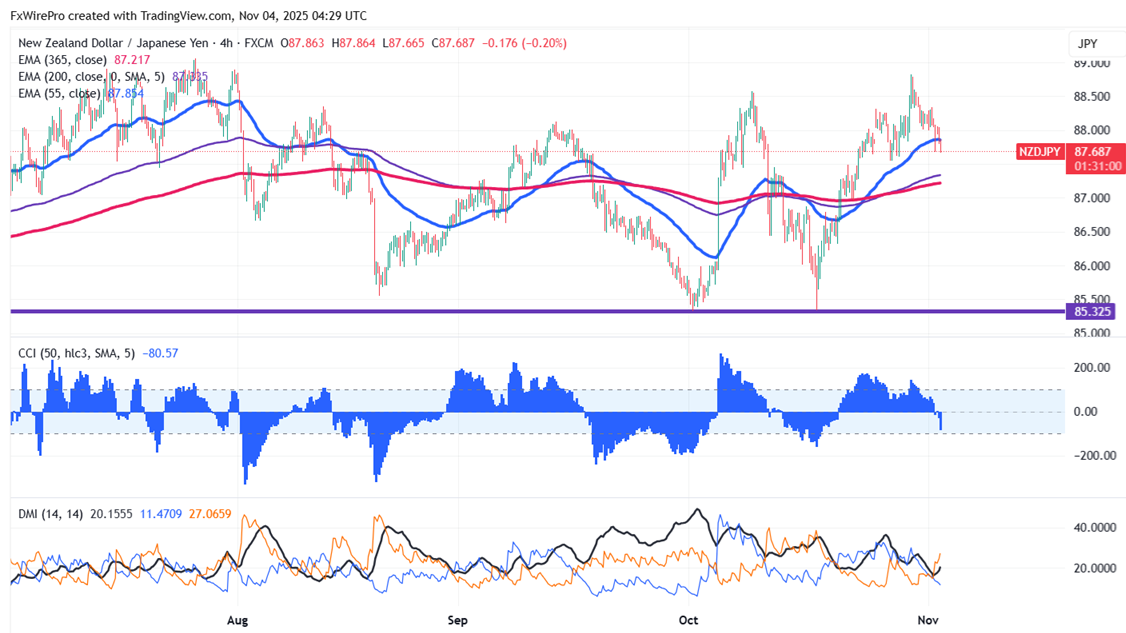
NZDJPY pared some of its gains on a weak New Zealand dollar. The intraday trend is bullish as long as support at 87.40 holds. Having reached an intraday low of 87.67, it now trades around 87.726.
Oscillators and moving averages to forecast the trend of NZDJPY
CMP- 87.726
EMA (4-hour chart)
55-EMA- 87.86
200-EMA- 87.28
365-EMA- 87.18. The pair trades above the short-term moving average and below the long-term moving average.
Major support- 87.80. Any breach below will drag the pair down to 87.40/86.95/86.40/86/85.37.
Major resistance - 88.10. Any break above 88.82 confirms minor bullishness, a jump to 89.25/90.
Indicator (4-hour chart)
CCI (50)- bearish
Average directional movement Index- Bearish. All indicators confirm a bearish trend.
It is good to buy on dips around 87.68-70, with an SL of 87.38 and a TP of 89.20/90.


