


 DAX & CAC40 Score Perfect 100: Extremely Bullish With Major Levels to Watch as FTSE100 Hits 80
  EURGBP Bears Break Trendline: Sell Rallies at 0.8578 as Support Breach Eyes 0.8450 Slide
  EUR/USD Rockets Past 1.1560 as Soft U.S. Jobs Data Fuel Fed Rate-Cut Surge
  FxWirePro: GBP/USD rises as weak U.S. jobs data pressures dollar
  FxWirePro: EUR/ AUD neutral in the near term, scope further downside
  FxWirePro: NZD/USD retreats as Middle East instability weighs
  FxWirePro- Woodies pivot (Major)
  NZDJPY Bears Lie in Wait: Sell Rallies at 93 for 90 Target with 94 Stop
  FxWirePro- Woodies pivot (Major)
  FxWirePro: USD/JPY holds tight range ahead of key U.S. payrolls data
  Bitcoin Reclaims $65,000 as Easing Geopolitical Tensions Fuel Risk-On Rally
  FxWirePro : EUR/NZD holding below 38.2% fibo ahead of US data
  Major Pair Currency Score: NZD/USD and AUD/USD Lead Forex Rally with Perfect 100 Scores
  FxWirePro- Major Crypto levels and bias summary
  FxWirePro- Major Pair levels and bias summary
  FxWirePro : USD/CAD falls as strong Canadian jobs data lifts loonie


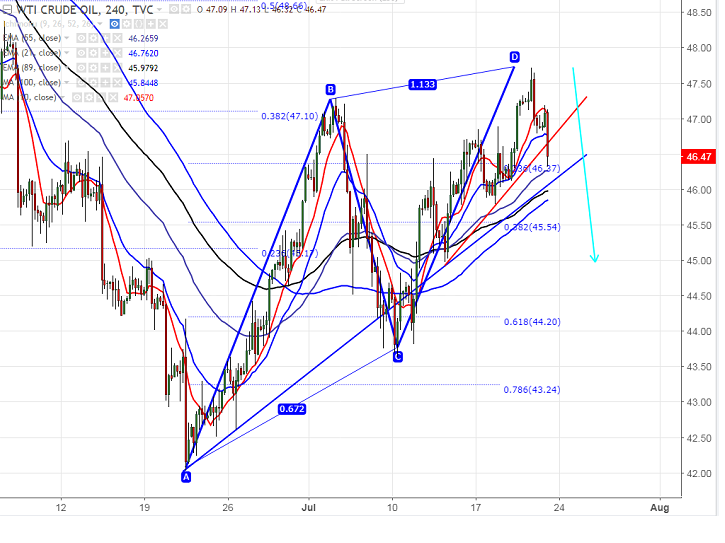
- Harmonic pattern – Bearish AB=CD.
- US Oil was trading higher for the past ten days from the low of $43.69 made on Jul 10th 2017. It has made a high of $47.71 and declining sharply from that level. It is currently trading around $46.47.
- Any major bullishness can be seen only above $47.71. Any break above will take the oil till $48.66/$50.
- On the lower side, near term support is around $46.35 (23.6% retracement of $42.03 and $47.77) and any break below will drag the commodity till $44.97/$43.69 (Jul 10th 2017 low).
It is good to sell on rallies around $46.65-$46.75 with SL around $47.80 for the TP of $43.69.







