


 FxWirePro- Woodies pivot (Major)
  FxWirePro: GBP/USD rises as weak U.S. jobs data pressures dollar
  FxWirePro : USD/CAD falls as strong Canadian jobs data lifts loonie
  AUDJPY Bears Poised: Sell Rallies at 111.55 for 108 Target with 112.20 Stop
  FxWirePro- Major Crypto levels and bias summary
  DAX & CAC40 Score Perfect 100: Extremely Bullish With Major Levels to Watch as FTSE100 Hits 80
  FxWirePro: GBP/AUD eases slightly, focus on near-term support
  FxWirePro- Major Pair levels and bias summary
  FxWirePro: USD/ZAR gains some ground, but downtrend remains
  FxWirePro: EUR/ AUD neutral in the near term, scope further downside
  Currency Score Alert: GBPUSD, AUDUSD & NZDUSD Top the Charts at 85 – Major Levels to Watch for Bullish Breakouts
  EURUSD Bulls Charge Higher: Buy Dips at 1.1528 as EMA Alignment Eyes Break Above 1.1560
  EUR/USD Rockets Past 1.1560 as Soft U.S. Jobs Data Fuel Fed Rate-Cut Surge
  NZDJPY Bears Lie in Wait: Sell Rallies at 93 for 90 Target with 94 Stop
  FxWirePro : EUR/NZD holding below 38.2% fibo ahead of US data


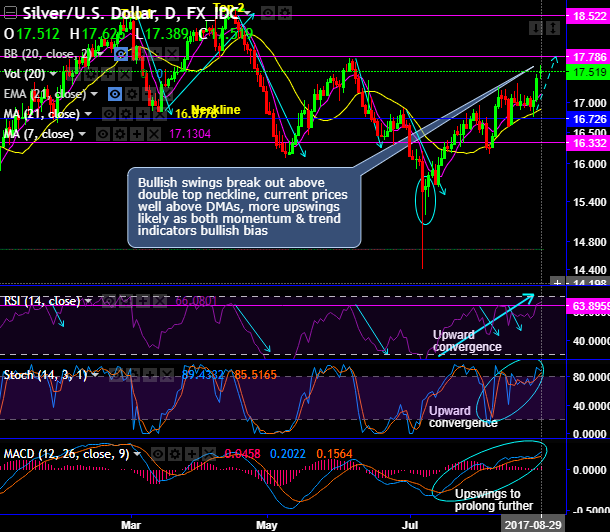
On daily plotting, historically, the double top pattern has occurred in silver price chart with peak 1 at 18.485 (that is where Back to back “shooting star” candle patterns are traced out), peak 2 at 18.647 and neckline at 16.847 levels. Currently, we’ve seen that bulls have tested supports at the same juncture. Prior to which, the bullish swings break out above double top neckline when lagging indicator shown bullish DMA crossover.
For now, the current prices remain well above DMAs, more upswings likely as both momentum & trend indicators bullish bias.
There has been constant spike above DMAs ever since it has bottomed out with the hammer pattern at 15.629 levels.
Most importantly, both momentum (RSI & stochastic) & trend indicators (DMAs & MACD) have been bullish bias.
While on monthly price behavior in consolidating phase seems to be convincing as the hammer pattern candlestick is occurred which is bullish pattern and price bias northward direction upto next stiff resistance of 18.522 levels.
RSI has been indecisive to the bull swings that signal the skepticism in the buying interests, while another leading oscillator stochastic has also been little indecisive although it signals momentum which is in line with this bullish pattern, it has not reached oversold region but we trace %k crossover (bullish crossover).
More evidently, MACD on this timeframe has been indecisive, so it is deemed that the trend wouldn’t sense any dramatic moves on either side.
Well, to conclude, the short term trend has absolutely been bullish bias, the prices can take off only if any abrupt dips test supports 7DMA levels that would mean that bulls likely to play their roles upto next immediate resistances of 17.786 and 18.522 levels.
However, we don’t think it would be wise to expect a steep recovery in the long lasting bear trend that we've seen since October 2012.
Instead, one can bid one touch binary call options in order to participate ongoing uptrend sentiments. Such leveraged trading instruments can append magnified effects to their pay off structures. Hence, buy one touch binary calls that can fetch as exponential yields as the underlying spot rates keep spiking higher.







